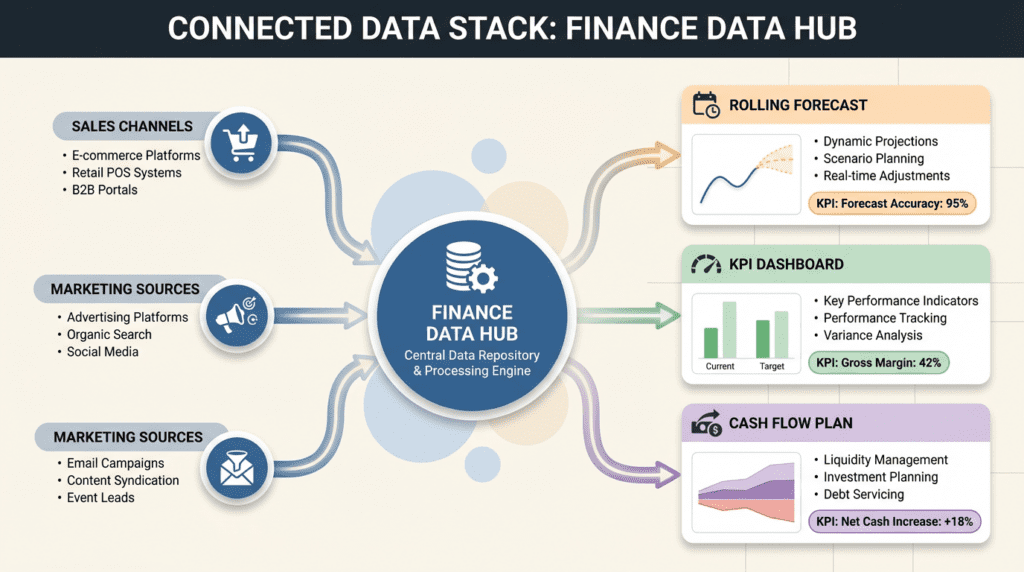
A Virtual CFO helps e-commerce brands scale profitably by implementing rolling forecasts, optimizing cash flow, and providing actionable insights into channel-level profitability.
Integrated financial systems and predictive forecasting enable better inventory management, working capital optimization, and data-driven decision-making for sustainable growth.
Partnering with a specialized fractional CFO provides executive-level financial expertise and technology integration at a fraction of the cost of a full-time hire, supporting confident, strategic scaling.
E-commerce brands often scale revenue faster than their financial controls can keep pace. McKinsey research shows that growth without cost discipline frequently destroys value in online retail. This creates cash flow blind spots, inventory inefficiencies, and channel profitability gaps that threaten sustainable growth.
A Virtual CFO solution bridges this gap by implementing rolling forecasts, tightening cash conversion cycles, and aligning channel-level profitability to strategy. Specialized e-commerce financial services deliver CFO-level leadership with data-driven KPI tracking without the full-time cost. We’ll explore how cash flow management, inventory forecasting, channel profitability analysis, and integrated data infrastructure transform e-commerce operations.
Ready to scale with financial discipline? Ascent CFO Solutions provides the strategic financial leadership your e-commerce brand needs to grow profitably.
Virtual CFO Services for E-commerce: From Cash Flow To Growth Strategy
When your e-commerce brand hits $10M in revenue, spreadsheet-based financial management becomes a growth bottleneck. A virtual CFO for ecommerce shows you which marketing dollars actually generate profitable sales after accounting for inventory costs and fulfillment expenses. Your fractional financial partner converts disconnected data into actionable growth decisions.
Strategic Financial Alignment Across Operations
Your financial partner analyzes the relationship between customer acquisition costs, lifetime value, and channel-specific margins. Instead of looking at revenue in isolation, they examine how marketing efficiency impacts inventory turns and working capital. This means understanding which products and channels actually drive profitable growth, not just top-line numbers. Fractional CFO services provide this strategic oversight without the full-time executive cost.
Operational Cadence Built on Predictive Forecasting
Expect a structured monthly rhythm centered on 13-week cash flow models and SKU-level contribution analysis. Your fractional CFO establishes forward-looking financial projections that connect demand planning with marketing spend and seasonal trends. According to Shopify’s cash flow guide, short-term predictive models help businesses anticipate cash needs and avoid working capital crunches during growth phases.
Systems Integration for Single Source of Truth
The right financial partner integrates your commerce platforms, fulfillment systems, and marketing tools into one comprehensive dashboard. Your fractional CFO connects Shopify or marketplace data with your ERP, 3PL systems, and advertising platforms. Shopify’s ERP integration research shows that disconnected systems create blind spots in inventory costs and margin analysis. When fulfillment data flows seamlessly into financial reporting, you gain real-time visibility into unit economics across all channels. Celigo’s integration research demonstrates how proper 3PL connectivity eliminates the manual data reconciliation that slows down financial decision-making. Your Virtual CFO builds data infrastructure that eliminates spreadsheet errors and provides accurate, timely financial insights.
Cash Flow Management And Inventory Forecasting For Online Retail
E-commerce brands often struggle with timing mismatches that tie up cash. You buy inventory upfront, spend on marketing before sales happen, and wait for customer payments to come in. A Virtual CFO helps solve these working capital challenges by implementing proven systems that predict and smooth these cash needs, turning reactive scrambling into proactive planning.
Build a rolling 13-week cash flow model that tracks weekly money coming in and going out, connecting inventory purchases to sales patterns and marketing spend schedules. This 13-week approach provides detailed weekly reviews where teams can spot problems early before they get worse.
Target a 46-day cash conversion cycle by measuring how long money stays tied up from buying inventory to collecting customer payments. The cash conversion cycle shows whether to focus on faster inventory turns, quicker customer collections, or extended supplier payment terms to free up working capital. Tracking the right ecommerce KPIs helps monitor these metrics consistently.
Use demand planning with ABC inventory segmentation to right-size purchase orders by blending past sales data with upcoming promotions and supplier lead times. ABC segmentation on your highest-volume SKUs helps prioritize working capital toward fast-moving products while reducing safety stock on slower items.
Align payment schedules strategically by negotiating supplier terms that match your inventory turn rates and adjusting marketing spend schedules to smooth monthly cash dips. For example, if you pay suppliers on the 15th, schedule major ad campaigns to start generating revenue by the 10th, creating natural cash buffers.
Connect forecasting systems that link your cash flow planning to inventory decisions, making sure purchase choices reflect both demand signals and available liquidity. This prevents buying inventory you can’t afford to carry or missing sales because money was tied up elsewhere.
These operational improvements become the foundation for scaling confidently. When you can predict and manage working capital needs 13 weeks ahead, growth becomes a strategic choice rather than a financial stress test.
Financial Forecasting, Channel Profitability, And Data Infrastructure
Rolling forecasts improve how e-commerce brands plan for growth by connecting revenue scenarios directly to operational realities. A Virtual CFO implements monthly rolling forecasts spanning 12-18 months that link traffic projections to cost fluctuations and operational capacity. These models adjust marketing spend efficiency and fixed cost absorption as market conditions shift. This approach replaces static annual budgets with dynamic planning tools that anticipate working capital needs. Research shows that companies using driver-based forecasting can achieve 20% better forecast accuracy compared to traditional methods. The result is a cash flow forecasting system that identifies growth constraints before they impact operations.
Beyond forecasting accuracy, true profitability visibility requires measuring contribution margins at the channel and customer cohort level, not relying on blended averages that mask unprofitable channels.
A Virtual CFO builds unit economics models that track customer acquisition costs, lifetime value, return rates, and discount impacts across Amazon, Shopify, wholesale, and other channels separately. This granular view reveals which channels actually drive profitable growth and which drain resources. The foundation for this analysis is an integrated finance data hub that connects commerce platforms, 3PL systems, ERP software, and marketing tools into a single dashboard. By eliminating spreadsheet drift and manual data reconciliation, brands gain the financial discipline needed to make faster, more accurate decisions about inventory, marketing spend, and channel strategy.
Virtual CFO FAQs For E-commerce Brands
E-commerce founders often wonder whether a Virtual CFO can address their specific financial challenges without the full-time executive cost. The questions below address the most pressing concerns around cash flow control, growth strategy, and implementation timelines that online retail businesses face.
What financial challenges do e-commerce brands face that a virtual CFO can solve?
E-commerce brands struggle with inventory cash management timing, channel profitability blind spots, and disconnected data systems. Virtual CFOs solve these by implementing rolling forecasts, margin analysis by SKU and channel, and integrated reporting. They transform scattered spreadsheets into actionable financial insights that support strategic decision-making.
Which e-commerce finance pain points does a Virtual CFO solve first?
A Virtual CFO immediately addresses cash flow visibility, SKU and channel profitability analysis, and forecasting discipline. They implement cash flow planning models that prevent stockouts and overbuying. The focus starts with working capital optimization and margin transparency across your sales channels.
How does a Virtual CFO drive strategic growth for online retail businesses?
Virtual CFOs align capital allocation with ROI data, enforce inventory buying discipline based on demand signals, and build scalable financial processes. They create KPI dashboards that connect marketing spend to lifetime value by channel. This analytics-based approach supports confident scaling decisions rather than assumption-driven growth.
What should be included in the first 90 days with a Virtual CFO?
The initial phase includes weekly cash review meetings, building a 13-week cash flow model, and cleaning up your chart of accounts. You’ll also get a comprehensive KPI dashboard and established monthly forecasting rhythm. This foundation creates the financial infrastructure needed for sustainable growth.
How does a Virtual CFO differ from hiring a full-time CFO for e-commerce?
Virtual CFOs bring specialized e-commerce experience at 60-70% cost savings compared to full-time executive salaries. They integrate your Shopify, Amazon, inventory systems, and marketing tools into unified financial insights. You get executive-level financial expertise without the overhead, plus flexibility to scale services as your business grows.
Choosing The Right Fractional CFO Partner
When evaluating Fractional CFO services for e-commerce, prioritize partners with proven experience improving cash conversion cycles and channel-level contribution margins. Look for demonstrated capability in data integration across commerce platforms, 3PLs, and marketing tools. According to McKinsey research, finance leaders now prioritize longer-term planning and technology-enabled insights.
This shift makes it even more important that your discovery conversation should assess current forecast maturity, existing KPI measurement capabilities, and the roadmap to a single source of truth. The right partner will outline specific deliverables for the first 90 days, including rolling cash flow models and channel profitability analysis. Shopify’s integration framework provides a useful benchmark for evaluating technical capabilities.
Ready to explore how strategic financial leadership can accelerate your e-commerce growth? Ascent CFO Solutions specializes in helping brands like yours build the financial infrastructure needed for sustainable scaling.
You’ve built something valuable. Now someone wants to buy it, or you’re looking to acquire a competitor. Either way, you’re about to enter a process where most deals fail to deliver expected value.
Understanding the M&A Lifecycle
The M&A lifecycle is rarely a straight line. It is a sequence of interdependent phases, each with its own objectives, risks, and potential failure points.
Many operating executives participate in only one or two transactions during their careers. Professional acquirers, private equity groups, and serial buyers execute deals repeatedly. That experience gap can introduce risk if it is not addressed deliberately.
You might negotiate attractive economics but structure the transaction poorly. You might secure a strong headline valuation but underestimate integration complexity. Or you might spend months in diligence only to discover that foundational strategic questions were never fully vetted.
Understanding the stages of the M&A lifecycle does not eliminate risk. It improves preparation and increases the probability of better outcomes.
Strategy and Planning Phase
M&A begins well before outreach or inbound interest. It begins with strategic clarity.
Acquisitions often disappoint when the underlying rationale lacks specificity. “We want to grow faster” is not a strategy. A defined objective such as entering a specific region, acquiring proprietary technology, or accelerating distribution capabilities provides clearer decision criteria.
For sellers, timing is equally strategic. Many advisors observe that exit outcomes tend to be stronger when businesses are performing well and market conditions are favorable. Waiting until growth slows or external conditions deteriorate can narrow options.
Planning considerations typically include:
Clearly defined strategic objectives
Internal capability assessment for execution and integration
Market timing and competitive landscape review
Preliminary valuation benchmarking
Determination of walk-away thresholds
Skipping strategic groundwork often leads to avoidable friction later in the lifecycle.
Target Identification and Initial Outreach
For buyers, target identification requires disciplined filtering. Criteria may include:
Revenue size
Geography
Customer profile
Product or technology capabilities
Cultural alignment
Early elimination of misaligned targets reduces wasted effort downstream.
Initial outreach dynamics vary. Cold outreach can generate interest, but warm introductions through trusted intermediaries frequently produce higher response rates.
For sellers, process control matters. Structured sale processes with multiple qualified bidders often create stronger negotiating leverage. Engaging with a single unsolicited buyer may still lead to a successful outcome, but it limits comparative market testing.
Due Diligence and Valuation
Due diligence is where high-level interest transitions into detailed validation.
Buyers examine:
Financial statements and quality of earnings
Customer concentration and contract terms
Key employee dependencies
Intellectual property ownership
Legal and regulatory exposure
Operational systems and controls
Issues uncovered during diligence are not automatically deal-ending. They frequently affect valuation, structure, or risk allocation.
For example, high customer concentration increases perceived risk and may influence price or earnout terms. Deferred operational investments may reduce valuation or prompt escrow adjustments.
Valuation approaches differ by industry:
Revenue multiples, often seen in SaaS and recurring-revenue businesses
EBITDA multiples, common in traditional operating businesses
Discounted cash flow modeling
Asset-based valuation
Earnout mechanisms to bridge valuation gaps
Buyers and sellers frequently emphasize different assumptions. Sellers often focus on projected upside. Buyers typically focus on current performance and execution risk. Early financial data preparation (clean financials, organized documentation) can speed up diligence for sellers by giving buyers confidence in the data.
All-cash transactions provide certainty but require available capital or financing. Stock transactions shift risk to the future performance of the combined entity. Earnouts tie portions of consideration to post-close results, aligning incentives but introducing uncertainty.
Closing represents a legal milestone, not completion of the process.
Effective transition planning ideally begins during diligence. Leadership alignment, communication planning, and operational mapping should not wait until signatures are finalized.
The early post-close period often determines long-term value realization. Clear communication to employees, customers, and vendors helps maintain continuity. Early operational clarity reduces disruption.
Both buyers and sellers sometimes underestimate the time and cost associated with transition obligations and integration workstreams.
Integration and Value Realization
Integration is where strategic intent becomes operational reality.
Revenue synergies may require more coordination than initially modeled. Cost efficiencies may introduce short-term disruption before benefits materialize.
Common integration workstreams include:
Systems consolidation
Financial reporting integration
Sales and marketing alignment
Operational standardization
HR policy harmonization
Cultural integration is frequently underestimated. Differences in decision-making styles, risk tolerance, or communication norms can undermine synergy realization if left unaddressed.
Integration timelines vary significantly based on complexity. Clear milestones and accountability structures reduce drift.
Optimism bias can influence both sides. Buyers may overestimate integration capability. Sellers may overestimate growth durability.
Disciplined analysis mitigates these risks but does not eliminate them.
Financial Leadership During M&A
M&A transactions demand financial capabilities beyond standard reporting.
The process typically requires:
Advanced financial modeling
Scenario analysis
Diligence coordination
Risk-adjusted valuation assessment
Deal structure evaluation
Integration financial planning
Controllers often manage financial reporting effectively. M&A, however, introduces strategic financial complexity that may exceed routine accounting functions.
Engaging experienced financial leadership during a transaction can provide additional perspective and structure. For companies that do not require a permanent CFO, fractional or interim leadership can align expertise with transaction timing.
FAQs: Common Questions About the M&A Lifecycle
1. How long does a typical M&A transaction take?
Timelines vary widely. Smaller, less complex transactions may close within 60 to 90 days. Larger or more complex transactions involving regulatory review or layered diligence often extend six months or longer.
2. What percentage of announced deals ultimately close?
Various industry studies suggest that a meaningful minority of transactions entering advanced negotiation do not close. Causes often include diligence findings, financing challenges, valuation gaps, or shifting strategic priorities.
3. Should we hire an investment banker?
For larger or more complex transactions, investment bankers often add value through market access, process management, and negotiation expertise. For smaller deals, internal capabilities and transaction complexity should guide the decision.
4. How much of the purchase price is typically held in escrow?
Escrow amounts often range between 10% and 20% of purchase price, commonly held for 12 to 24 months. Terms vary based on perceived risk and negotiating leverage.
5. How do we know if our company is ready for M&A?
Indicators of readiness include clean financial reporting, documented processes, manageable customer concentration, defined growth drivers, and organizational clarity. A practical test is whether requested diligence materials could be produced promptly and confidently.
The management team plays an equally important role in signaling readiness. Buyers and investors don’t just evaluate financials — they evaluate the people behind them. A well-structured management team demonstrates readiness by showing clear ownership of key functions, consistent decision-making processes, and the ability to operate without being overly dependent on a single founder or executive. During diligence, acquirers will assess whether the team can execute post-transaction, how leaders communicate strategy, and whether there are gaps in critical roles that could create risk after close.
The CFO sits at the center of this evaluation. Beyond preparing and defending the financial package, the CFO helps the management team present a coherent story — one where the numbers, the strategy, and the people all align. A CFO who has been embedded in the business as a strategic partner, rather than just a reporting function, makes that story far easier to tell and far harder to challenge. Companies heading into an M&A process without that level of financial leadership at the table typically find diligence slower, messier, and more expensive than it needed to be.
When to Bring in Professional M&A Support
Many companies enter M&A discussions with strong operational teams but limited transaction-specific experience.
Ascent CFO Solutions works with growth-stage companies navigating acquisitions and exits.
Our team supports:
Financial modeling and valuation stress testing
Due diligence coordination
Deal structure evaluation
Integration planning and financial oversight
Engagement structures are flexible and aligned to transaction scope rather than requiring a permanent executive hire.If your organization is considering an acquisition, preparing for exit, or evaluating strategic alternatives, booking a discovery call can clarify whether your current financial capabilities align with the complexity ahead.
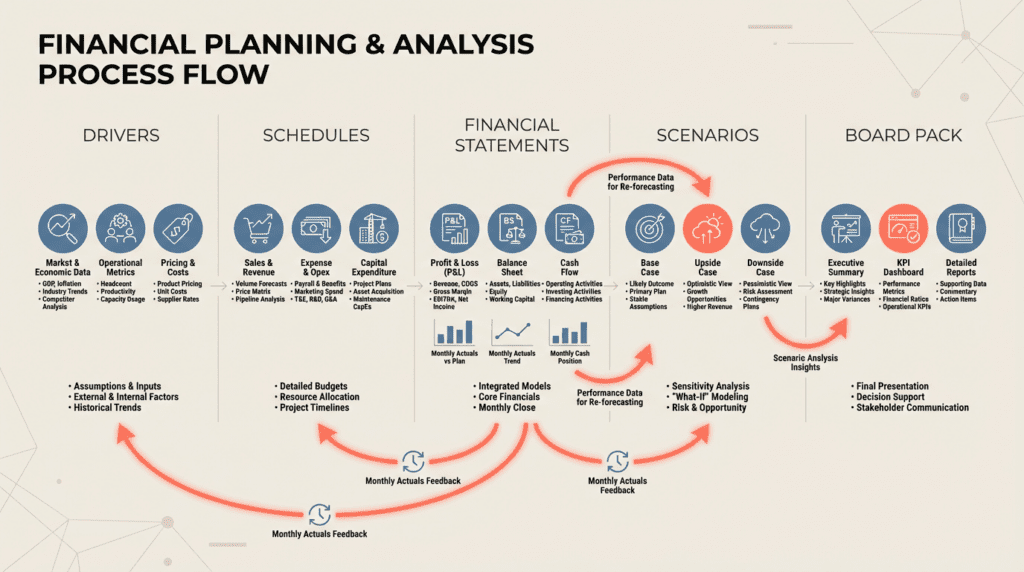
Board-ready financial projections must tie every financial line item to measurable operational drivers, ensuring clarity and accountability for board members.
Integrated three-statement models with scenario planning provide a comprehensive, actionable view of a company’s financial health, enabling boards to evaluate strategic options and trade-offs.
A disciplined workflow—including rolling updates, consistent governance, and focused presentation—transforms financial forecasts from static reports into dynamic tools for strategic board discussions and confident decision-making.
Industry research reveals a concerning trend: most board members receive financial projections they can’t use for strategic decision-making. Entrepreneurs typically present dense spreadsheets filled with assumptions that lack operational context. Boards don’t want more numbers: they want clear, defensible projections that connect your business drivers to strategic choices and trade-offs.
Building board-ready financial projections requires connecting operational metrics to GAAP financials, incorporating multiple scenarios, and framing decisions with clear runway visibility. This guide covers the components, step-by-step workflow, presentation tactics, and common questions that help growing businesses transform their forecasting from reactive reporting to strategic advantage.
Ascent CFO Solutions specializes in building board-ready forecasting systems that transform how growing businesses present to their boards.
Key Components Of Board-Ready Financial Projections
Board-ready financial projections require three foundational components that separate professional forecasting from ad hoc approaches. What are the key components of board-ready financial projections that drive strategic decisions? Your board needs to see the operational story behind the numbers, complete financial integration across all statements, and robust governance that builds confidence in your forecasting process.
Connect Every Dollar To Operational Drivers
Revenue projections must be grounded in measurable business drivers, not assumptions. Tie every line item to specific operational metrics that your team actually tracks and controls. Revenue flows from units sold, conversion rates, and pricing decisions. COGS connects to material costs, labor productivity, and vendor terms. Hiring plans link directly to headcount growth, compensation bands, and productivity ramps. Driver-based planning eliminates black-box assumptions and gives your board confidence that projections reflect real business levers under management control.
Build Integrated Three-Statement Models With Scenarios
Board-ready projections require complete integration across your P&L, balance sheet, and cash flow statements. Revenue timing shifts directly impact working capital requirements. Hiring decisions affect both operating expenses and cash flow timing. Equipment purchases flow through depreciation and financing needs. Your model should include scenario toggles for base, upside, and downside cases, with clear visibility into covenant compliance and runway calculations. This integrated approach paired with comprehensive cash flow forecasting ensures your board sees the complete financial picture, not isolated metrics. Consider following an investor-ready financial model framework to maintain professional standards.
Establish Single Source Of Truth With Rolling Updates
Robust governance separates professional projections from inconsistent forecasting practices. Maintain one master model with clear version control and designated ownership. Implement a 12 to 24-month rolling horizon that updates monthly with actual results. Your board should receive consistent formatting with a 30/60/90-day update cadence that shows variance explanations and revised assumptions. This disciplined approach, similar to what we outline in our financial forecasting methodology, builds credibility and enables informed decision-making when market conditions change.
Step-By-Step Workflow To Build Board-Ready Projections
How can startups ensure accuracy and credibility in financial forecasts for board presentations? The answer lies in building a systematic workflow that connects operational reality to financial outcomes. Rather than starting with spreadsheet templates, successful companies begin with the business drivers that actually move the numbers.
Map Your Business Drivers First
Start by identifying the 7-10 metrics that directly impact your revenue, margins, operating expenses, and working capital. These might include customer acquisition cost, monthly recurring revenue per user, gross margin by product line, or sales team productivity ratios. Driver-based forecasting creates transparency and accountability. Assign clear ownership for each metric and validate your data sources. When board members ask tough questions, you’ll have specific owners and reliable data backing every assumption.
Build Integrated Financial Statements
With your drivers mapped, assemble detailed schedules for revenue, cost of goods sold, headcount planning, capital expenditures, and funding requirements. These schedules should roll seamlessly into your profit and loss statement, balance sheet, and 13-week cash flow statements. Cash flow forecasting becomes the foundation for runway visibility and covenant compliance. This integrated approach prevents the disconnected spreadsheets that often plague growing companies and confuse board discussions.
Execute An 11-Week Implementation Sprint
Break your model-building into three focused phases with experienced Fractional CFO guidance. Phase 1 involves data hygiene and driver validation over four weeks. Phase 2 covers model construction and testing over the next four weeks. Phase 3 focuses on scenario design with Base, Downside, and Upside cases, plus decision gates for capital allocation over three weeks. Scenario planning helps boards understand trade-offs and timing for strategic decisions. This structured timeline prevents endless revisions and delivers a working model that scales with your business.
From Numbers To Narrative: Tailoring Projections For Board Discussions
Raw numbers alone won’t drive board decisions. Your projections need to tell a clear story that connects financial data to strategic choices and business outcomes.
Structure presentations with a 3-slide arc: Where We Are (current KPIs), What Changed (variance drivers), What’s Next (scenarios with runway impact)
Present 2-3 quantified levers per scenario: Show specific outcomes for pricing changes, CAC efficiency improvements, or hiring pace adjustments
Lead with cash runway in months: Board members need immediate visibility into funding timeline and cash burn
Limit board packs to 10-12 pages maximum: Include executive summary, key metrics dashboard, and top 3 risks with mitigation plans
Show choices, not predictions: Frame scenarios as strategic options with clear trade-offs rather than single-point forecasts
According to Bessemer Venture Partners, effective board presentations combine quantitative scenarios with qualitative context that helps directors understand the business implications behind the numbers. Your financial forecasts should guide decision-making rather than simply report projections.
The goal is transforming your projections into a strategic tool that accelerates board discussions and enables faster, more informed decisions about your company’s future.
FAQs: Financial Projections For Board Meetings
Board members ask pointed questions about resource allocation, growth investments, and risk management. These answers address the most common concerns about turning financial projections into actionable board decisions that drive sustainable growth.
How do financial projections directly support board decisions on capital allocation and hiring?
Projections translate strategic choices into financial outcomes. When boards see hiring plans tied to revenue per employee metrics, or CapEx requests linked to capacity constraints, they can approve resources confidently. Harvard Business Review emphasizes connecting forecasts to resource needs for effective board governance.
How do we operationalize a 30/60/90 update rhythm effectively?
Day 30: Close the books and update actuals. Day 60: Refresh drivers and scenarios. Day 90: Present full board package with variance analysis. BVP Atlas recommends this cadence to balance accuracy with operational efficiency while keeping boards informed.
What cadence should we maintain for updating board-ready projections?
Refresh your rolling 12-month forecast each month, present scenarios quarterly, and maintain a 13-week cash flow updated weekly. Fractional CFO services help establish this rhythm without overwhelming your team.
How can we improve forecast accuracy without slowing business operations?
Focus on the 7-10 drivers that move 80% of your business—like customer acquisition cost, monthly recurring revenue, and gross margin for SaaS companies. Automate data collection where possible and track forecast variance by driver each month. Accuracy improves through consistent measurement, not complex models.
What time horizon should board projections cover?
Maintain a rolling 12-24 month outlook with quarterly detail for the first year. Include 3-5 year strategic milestones for context. This horizon supports both operational decisions and strategic planning while remaining credible and actionable for board discussions.
How should we handle significant forecast misses in board presentations?
Address variances head-on with root cause analysis and corrective actions. Present the miss, explain the driver that changed, and show your updated assumptions going forward. Boards respect transparency and decisive responses more than perfect predictions.
Conclusion: Turn Your Projections Into A Strategic Advantage
Board-ready financial projections transform raw data into business decision-making tools. When you connect operational drivers to integrated financial statements and present scenarios with clear trade-offs, you move from reactive reporting to proactive leadership. Effective board interactions require executives to deliver concise, data-driven insights that support tactical discussions and drive confident decision-making.
However, building this capability requires more than good intentions. Consistent execution with governance controls, scenario planning, and reliable cash flow forecasting positions your company for confident capital allocation and growth decisions. Success demands expertise in both financial modeling standards and board-level presentation frameworks.
Ready to build projections that drive board confidence and operational clarity? Ascent CFO Solutions can help you implement a board-ready projection process within 90 days.
CFO-led buy-side financial due diligence is essential for uncovering hidden risks, validating financial assumptions, and protecting deal value during acquisitions.
A structured, sequenced diligence process—driven by clear decision-critical questions and actionable outputs—translates raw data into price adjustments, negotiation terms, and integration plans.
Fractional CFO expertise enables growth-focused companies to access specialized due diligence leadership and insights without the overhead of a full-time hire, accelerating confident, successful acquisitions.
Research shows that up to 85% of deals fail to deliver expected returns. The fastest way to destroy deal value is skipping disciplined buy-side financial due diligence. When growth-focused companies rush through acquisitions without proper financial validation, they often discover hidden risks, inflated metrics, and integration nightmares that can sink the entire investment thesis.
This is where strategic CFO leadership makes the difference. A CFO-led diligence process translates raw data into price adjustments, specific contract terms, and integration priorities that protect downside while accelerating post-close value creation. With buy-side carve-outs representing 28% of all transactions and tech deals requiring specialized revenue recognition analysis, for example, disciplined financial validation has become a competitive advantage. We’ll explore what’s involved in comprehensive buy-side financial due diligence, how a CFO leads the process end-to-end, and critical tech-specific analyses that separate winning deals from costly mistakes.
Ascent CFO Solutions provides experienced Fractional CFO expertise to scope, lead, and synthesize your buy-side financial due diligence into actionable deal insights.
What’s Involved in Buy-Side Financial Due Diligence
Buy-side financial due diligence transforms raw target company data into deal decisions. The process goes far beyond reviewing financial statements—it requires a CFO to orchestrate multiple workstreams, manage tight timelines, and convert findings into price adjustments and integration plans that protect your investment.
Define Decision-Critical Questions Before You Start
Experienced acquirers start with three deal-defining questions: What drives valuation? What would make you walk away? What must be true for post-acquisition success? This upfront scoping prevents unfocused analysis that delays decisions and keeps teams concentrated on findings that actually change your go-no-go decision. The Angel Capital Association emphasizes identifying “deal breakers” and “acceptable risks” before deep analysis begins. For tech acquisitions, these questions typically center on revenue quality, customer concentration, and data integrity—not every line item in the financial statements.
Run Sequenced Workstreams Across Core Financial Areas
Once you’ve defined your scope, a structured approach prevents rework and blind spots. Effective CFOs deploy a comprehensive data request covering revenue recognition, margin analysis, working capital patterns, debt-like obligations, and forecasting assumptions. For instance, revenue quality analysis might reveal that 40% of ARR comes from month-to-month contracts, directly impacting valuation multiples. The CAIA Association research shows that sequencing matters—financial analysis informs legal review, which shapes operational assessments. Ascent CFO Solutions’ M&A advisory follows this coordinated approach, deploying Fractional CFO expertise to manage these complex workstreams without the overhead of full-time hires.
Convert Findings Into Deal-Moving Artifacts
With structured workstreams in place, due diligence only creates value when findings translate into action. The three outputs that matter most: purchase price adjustments based on working capital or debt discoveries, specific representations and warranties that allocate risk, and a 100-day integration plan tied to your investment thesis. According to UKRI guidance, successful processes culminate in “a comprehensive due diligence report and an updated term sheet.” These artifacts become your roadmap for negotiations and post-close value creation, rather than static documentation.
How a CFO Leads the Due Diligence Process End-to-End
Fast-growing companies often face a dilemma: move quickly on attractive acquisition targets or risk losing deals to competitors who act faster. The question “can a CFO lead buy-side financial due diligence” has a clear answer: absolutely, and they should. A CFO brings the financial expertise and cross-functional leadership needed to transform raw data into actionable deal intelligence without sacrificing speed for thoroughness.
Here’s how they orchestrate the entire process from kickoff to close, ensuring both pace and precision:
Chair weekly diligence stand-ups that keep all workstreams aligned on the same priority list, with legal and tax teams reporting progress against deal-critical questions rather than working in silos
Resolve blockers within 24-48 hours by having direct authority to escalate data requests, clarify scope with sellers, and make decisive calls about what’s material versus what’s noise
Pressure-test revenue quality by validating ARR-to-GAAP bridges, analyzing customer concentration risks, and normalizing EBITDA to strip out one-time items that inflate seller projections
Isolate hidden obligations, including deferred revenue, earn-out commitments, and working capital requirements that directly impact the true purchase price and cash needs post-close
Convert risks into negotiation terms by translating data gaps into escrow requirements, unproven revenue streams into earnout structures, and working capital inefficiencies into purchase price adjustments that protect deal value
Build the 100-day integration plan during diligence rather than after close, identifying system dependencies, key personnel retention needs, and operational improvements that protect deal value from day one
Buy-Side Financial Due Diligence FAQs
CEOs evaluating acquisitions often face complex decisions with limited time and incomplete information. The following questions address common concerns about structuring, protecting, and accelerating the due diligence process to make confident acquisition decisions.
What are the key steps in buy-side financial due diligence for acquisitions?
Buy-side financial due diligence follows a structured sequence: data collection, financial analysis with adjustments, forecast validation, working capital assessment, and risk evaluation. EY-Parthenon emphasizes translating findings into actionable deal terms through pricing mechanisms and purchase agreement protections. Finally, the process includes post-acquisition strategy and a 100-day value creation roadmap.
How does buy-side financial due diligence protect against acquisition risks?
Financial due diligence identifies deal killers before they become expensive surprises. The process validates revenue quality, normalizes earnings to reveal true profitability, and uncovers hidden liabilities or working capital drains. PwC notes that tech-enabled analysis transforms assumptions into validated facts. Critical areas include cybersecurity and IT infrastructure, as Deloitte research shows these assessments prevent operational disruption.
Can outsourcing buy-side financial due diligence improve acquisition outcomes?
Experienced advisors offer specialized tools, benchmarking data, and transaction experience that internal teams often lack. This approach reduces internal resource strain, particularly valuable for scaling companies that lack internal M&A experience, and delivers objective perspectives that strengthen negotiation positions. Ascent CFO Solutions’ M&A services provide due diligence management with comprehensive execution support that accelerates timelines while maintaining analytical rigor.
What should CEOs prioritize when selecting a due diligence advisor?
CEOs should prioritize advisors who deliver actionable insights within compressed timelines. Look for teams that integrate financial, commercial, and operational assessments into unified recommendations. The process should produce three outputs: purchase price adjustments based on normalized financials, specific representations and warranties addressing identified risks, and a detailed post-close plan. Interim CFO support can provide rapid deployment when internal finance teams need additional full-time or near full-time M&A expertise.
Turn Diligence Into Confident Action With a Fractional CFO
Buy-side financial due diligence transforms from a compliance exercise into competitive advantage when led by an experienced CFO. The right leader converts raw financial data into three actionable outcomes: precise purchase price adjustments, targeted representations and warranties, and a 100-day integration plan that captures forecasted synergies.
This transformation requires Fractional CFO services for buy-side due diligence that provide expertise and flexibility. They coordinate quality of earnings (QoE) reviews, validate revenue assumptions, and translate findings into negotiation leverage that protects downside and accelerates transaction success. Your next acquisition deserves this level of financial rigor and strategic insight.
Ready to convert due diligence into confident deal terms and measurable post-close value? Ascent CFO Solutions can scope your next acquisition with the decision-grade analysis that accelerates transaction success.
Prioritize interim CFO firms that offer immediate availability, team-based delivery, and a 95-day execution plan to ensure rapid stabilization and growth during leadership transitions.
Look for firms with deep industry-specific expertise and a proven track record of delivering measurable results, such as improved cash flow visibility, accelerated fundraising readiness, and operational streamlining.
Ask targeted questions about team structure, deliverables, and governance processes to ensure consistent, reliable financial leadership and knowledge transfer throughout the engagement.
When your CFO departs unexpectedly or you’re navigating a fundraising round, 90% of companies prioritize operational experience in their interim hire. The wrong choice can significantly impact your runway and growth trajectory. The right interim CFO firm becomes your financial anchor during the storm.
The question of what should we look for in an interim CFO firm requires looking beyond individual credentials to partnership capabilities. Growth-focused leaders evaluate firms on their ability to deliver speed to impact, team-based expertise, industry fluency, and reliability under pressure. The most effective partnerships provide full-time CFO leadership with immediate availability, a cohesive support team, and fresh data-driven perspectives that accelerate growth rather than just maintain operations.
For immediate, full-time CFO leadership during critical transitions, explore how Ascent CFO Solutions delivers strategic financial guidance when you need it most.
Core Evaluation Criteria for Choosing an Interim CFO Firm
Your CFO just gave notice. The interim CFO you choose in the next week will either stabilize your growth or accelerate your decline. When you evaluate an interim CFO firm, the stakes are high. The right partner delivers immediate value, brings a complete team, and understands your industry’s unique challenges from day one.
Speed to Impact Beats Perfect Timing
Your interim CFO should be able to step in within 48 hours and deliver strategic value from week one. Industry data shows that 60% of interim CFO projects occur in Q3 and Q4, when time pressure is highest. The best firms have standardized playbooks that let them assess your situation, prioritize actions, and start contributing immediately without lengthy onboarding periods.
Choose Teams Over Individual Consultants
A cohesive team with CFOs, controllers, accounting managers, and financial analysts consistently outperforms individual consultants in complex growth environments. Team-based delivery provides backup coverage, diverse expertise, and knowledge continuity that single operators cannot match. When evaluating firms, ask about their support structure and how they ensure consistent service if the lead CFO becomes unavailable. Companies with collaborative teams can handle multiple initiatives simultaneously while maintaining quality and responsiveness across all your financial needs.
Demand Industry-Specific Expertise
Broad financial expertise alone won’t suffice. Your interim CFO firm must demonstrate specialized knowledge of your sector’s metrics, benchmarks, and capital markets dynamics. SaaS companies need expertise in ARR bridges, cohort analysis, and revenue recognition, while manufacturing firms require inventory management and supply chain finance skills. Ask candidates to articulate specific challenges they have solved in your industry and what KPIs they would track from day one.
Questions to Ask When Hiring an Interim CFO Firm
The right questions reveal whether a firm can deliver immediate value during your leadership transition. Smart CEOs probe beyond credentials to understand team structure, industry depth, and concrete deliverables.
What questions should we ask when hiring an interim CFO firm? Ask these specific questions to identify firms that deliver measurable results:
Team composition: Do you guarantee a good match with the Interim CFO? Who handles day-to-day work when the Interim CFO is unavailable or traveling?
Industry benchmarks: Which growth-stage companies in our sector have you served?
First-week deliverables: What specific outputs like cash flow forecasts will you provide within 7 business days?
Decision timeline: What strategic decisions will you help us make within 30, 60, and 95 days?
Succession planning: How do you prepare our team and document processes for the permanent CFO transition?
These questions help you identify firms that offer team-based delivery rather than individual heroics. Research shows that strong governance during interim periods reduces financial reporting risks and improves long-term outcomes.
The best interim CFO firms provide specific, measurable commitments rather than vague promises. Understanding these capabilities helps you see how these partnerships actually drive growth during critical transitions.
How Interim CFO Firms Drive Growth During Leadership Transitions
Interim CFO firms stabilize operations by implementing weekly cash visibility and rolling 13-week forecasts that keep hiring, pricing, and investment decisions on track during change. They establish board-ready reporting cadences and scenario modeling to preserve stakeholder confidence when leadership gaps emerge. This approach delivers measurable results: one recent case study showed an interim CFO helped achieve a 20% revenue increase and 15% cost reduction within the first year through rigorous cash management and operational streamlining.
Beyond operational stability, leading interim CFO firms accelerate fundraising readiness by building lender-grade data rooms, refining unit economics, and translating business narratives into numbers that accelerate diligence. They provide objective diagnostics on processes, talent, and systems to remove bottlenecks and align organizations around a single source of financial truth. This fresh perspective proves invaluable during transitions, as interim leaders can align stakeholders and implement changes without internal politics or historical biases constraining decision-making.
When evaluating interim CFO firms, you need clear answers about reliability and execution quality. These questions address the operational realities of maintaining financial leadership during critical business phases.
How do interim CFO firms ensure continuity if the lead CFO becomes unavailable?
Reputable firms use team-based delivery rather than single practitioners. Your engagement includes a lead CFO plus supporting controllers and analysts as needed. Weekly finance huddles and documented processes ensure seamless collaboration.
What startup experience should an interim CFO firm demonstrate?
Look for firms with extensive experience in your sector’s unit economics, fundraising cycles, and growth metrics. They should immediately understand CAC, LTV, burn rates, and cash conversion cycles without lengthy explanations. Industry-specific experience shows up in day-one contributions to board decks, investor updates, and strategic planning rather than generic financial reporting.
How do you measure success and accountability during the engagement?
Effective firms establish clear cadence and deliverables from week one. Expect weekly cash reviews, monthly close within 5-10 business days, and quarterly rolling forecasts. Success metrics include improved cash visibility, faster decision-making, and investor-ready financial packages. KPI dashboards should integrate with your existing systems to create a single source of truth.
What governance structures ensure reliable execution throughout the engagement?
Professional firms implement structured communication rhythms including daily check-ins during critical periods, weekly leadership updates, and monthly board-ready packages. They document all processes following proven methodologies, maintain audit trails, and provide transparent reporting on engagement milestones. This governance framework ensures consistent execution regardless of personnel changes or business volatility.
Next Steps: Choose a Fast, Friendly, Flexible Interim CFO Partner
When evaluating interim CFO services, your decision checklist should prioritize timely availability, team-based delivery, and sector fluency. The right partner steps in within 48 hours and delivers cash flow visibility and board-ready reporting from week one. Best practices in executive transitions show that having pre-identified interim candidates and formal protocols maintains investor confidence during leadership changes.
Beyond evaluation criteria, focus on partners who stabilize finance operations, accelerate strategic decisions, and leave your organization stronger for the permanent hire. The best interim engagements combine immediate operational fixes with knowledge transfer that builds lasting capabilities.
Ready to secure interim financial leadership during your critical transition? Ascent CFO Solutions delivers immediate, full-time CFO support with as soon as 48-hour availability and industry-specific expertise to guide your business through leadership changes.
Fractional CFO-led M&A services—covering strategy, due diligence, and post-close integration—are critical for SMBs to achieve sustainable growth and protect deal value.
Comprehensive due diligence, including quality of earnings reviews and operational assessments, is non-negotiable for mitigating risk and ensuring successful transactions.
Selecting the right advisory partner with experience in SMB-sized deals and a clear operator’s perspective is essential to avoid unnecessary fees, prevent value leakage, and ensure accountability throughout the M&A process.
Most growing businesses spend heavily on investment bankers and lawyers, yet struggle with deals that stall or fail post-close. The real question isn’t whether you need M&A help—it’s what M&A services actually create value. Right-sized, Fractional CFO-led support across strategy, diligence, and integration delivers sustainable outcomes that protect value and speed close.
The Core SMB M&A Services: Before, During, and After the Deal
Many business owners jump into M&A conversations without proper preparation, which can cost them value and create unnecessary risk. Effective SMB M&A services follow a disciplined three-phase approach that protects value at every step. Whether you’re buying or selling, the right support spans deal readiness, transaction management, and post-close integration.
Before the Deal: Building Transaction Readiness
Deal readiness starts with operational KPI hygiene and financial modeling that can withstand buyer scrutiny. Your Fractional CFO should prepare three-statement models—integrated income statement, balance sheet, and cash flow projections—establish valuation ranges, and screen targets based on strategic fit. This groundwork enables focused outreach to qualified opportunities and positions you to move quickly when the right deal emerges. Clean financials and documented processes signal serious intent to counterparties.
During the Deal: Managing Transaction Complexity
Transaction management requires coordinating multiple workstreams while maintaining business operations. Quality of earnings (QoE) oversight—independent verification of financial performance—protects against surprises, while proper lender package preparation keeps financing on track. Buy-side and sell-side diligence coordination prevents critical issues from being overlooked. According to Deloitte’s integration framework, pressure-testing readiness at multiple checkpoints prevents operational disruptions that damage cash flow and customer confidence.
After the Deal: Executing Integration for Value Capture
Integration separates successful deals from expensive mistakes. A structured 90-day plan with clear owner-operator transition milestones prevents cultural and operational drift. Systems consolidation and working capital governance lock in projected synergies before they evaporate. BCG research shows that disciplined post-merger integration captures 9% more value than ad-hoc approaches. Speed matters—delayed integration decisions compound into permanent value leakage.
Due Diligence Services SMBs Cannot Skip
Smart buyers know that proper comprehensive due diligence separates successful deals from costly mistakes. While every deal has unique requirements, these core areas demand attention in any SMB transaction.
Independent Quality of Earnings review validates sustainable EBITDA, normalizes working capital for seasonal patterns, and catches revenue timing manipulation or hidden one-time expenses
Customer concentration analysis identifies dependency risks when any single customer represents over 25% of revenue
Contract assignment verification confirms key agreements transfer without triggering change-of-control clauses or consent requirements
IP and licensing audit ensures trademarks, patents, and software licenses are properly documented and transferable
System compatibility assessment identifies integration risks between accounting systems, CRMs, and databases before they derail post-close operations
As outlined in our due diligence preparation guide, these foundational checks protect your investment and speed closing timelines. The next step involves finding the right advisory team to execute this work efficiently and within your resource constraints.
How to Evaluate the Right M&A Advisory Partner for Your SMB
When evaluating how SMBs can choose the right M&A advisory firm for their business, start by confirming the advisor regularly handles transactions in your revenue range. Look for firms with proven experience in $5M–$50M deals and established relationships with lenders who understand your sector. According to the SBA’s guidance, comprehensive due diligence and proper legal review are essential for small businesses. Advisors who specialize in your deal size understand the unique challenges SMBs face during valuation, financing, and integration phases.
Prioritize advisory partners who offer an operator’s perspective through Fractional CFO or Virtual CFO capabilities. The right advisor should own your financial model, manage lender dialogue, coordinate diligence management, and develop integration roadmaps. Demand transparent pricing with fixed-fee or milestone-based structures rather than vague “full service” promises. Clear deliverables, timelines, and payment terms protect your interests and ensure accountability throughout the process.
SMB M&A Services: Frequently Asked Questions
Business owners preparing for transactions often struggle to identify which services truly drive value. These common SMB M&A FAQ answers focus on practical guidance for financial preparation, integration priorities, and coordinating your advisory team effectively.
What financial preparation support do SMBs need when preparing for a merger or acquisition?
Start with rolling forecasts and scenario modeling to establish baseline performance and valuation ranges. Develop clean financial statements, normalize working capital by seasonality, and prepare investor-ready models that highlight key value drivers. Recent FP&A research confirms that using multiple valuation methods reduces bias and strengthens negotiating positions.
Which post-merger integration services are most beneficial for SMBs?
Focus on systems integration, unified financial reporting, and customer retention planning within the first 90 days. Studies demonstrate that SME M&As generate significant sales growth and labor productivity improvements when integration prioritizes operational synergies and technological complementarities. Establish shared KPIs, harmonize accounting processes, and create joint communication channels to preserve relationships during transition.
How should SMBs balance banker, legal, QoE, and Fractional CFO roles without duplicating work or fees?
Assign clear ownership: bankers handle deal sourcing and negotiations, legal manages contracts and compliance, QoE providers verify historical performance, and Fractional CFOs coordinate financial modeling and integration planning in addition to supporting the QoE and due diligence processes. This division prevents overlap while ensuring each advisor focuses on their core expertise. Structure engagements with defined deliverables and milestone-based pricing to control costs.
When should SMBs engage M&A advisory services during the transaction process?
Begin financial strategy work 6-12 months before initiating the sale process with systems cleanup, KPI standardization, and preliminary valuation work. Engage transaction advisors 3-6 months before launch to allow adequate time for materials, target screening, and due diligence preparation. Post-integration planning should start during due diligence to ensure smooth execution after closing.
What are the most common M&A service mistakes SMBs make?
SMBs commonly underestimate integration complexity, rely on overly optimistic financial projections, and fail to retain key employees during transition. Many also skip independent quality of earnings (QoE) reviews or rush cultural integration. Successful transactions require conservative cash flow planning, detailed integration roadmaps, and dedicated Fractional CFO support for managing both deal processes and ongoing operations simultaneously.
Build Sustainable Value With the Right M&A Support
SMBs create lasting value when they pair thorough due diligence with a focused 90-day integration plan that safeguards cash flow, customer relationships, and company culture. The most successful deals don’t end at signing—they begin with structured post-close execution that prevents the operational disruption that derails many acquisitions.
The key to this success lies in engaging a Fractional CFO as your orchestrator, managing financial modeling, lender communications, due diligence coordination, and operational cadence during transition. Recent academic research states that businesses with this financial leadership achieve 40% higher survival rates during economic stress—precisely what SMBs need when navigating complex M&A processes.Ready to align your M&A strategy with services that actually drive sustainable growth?
Schedule a CFO call to discuss how the right financial leadership can protect your next deal’s value from day one.
An investor-ready financial model is more than just numbers—it must integrate key components like validated assumptions, scenario planning, unit economics, and cash flow forecasting to build investor confidence and support strategic decision-making.
Transparency, modular structure, and operational alignment are critical; every projection should be traceable to clear business drivers, and the model should seamlessly connect to real data sources and operational plans.
Ongoing refinement, scenario and sensitivity analysis, and clear communication of capital requirements and milestones turn your financial model into a dynamic tool for both fundraising and sustainable growth.
Investors scan your pitch deck financials in under two minutes, yet 70% of funding requests fail due to inadequate financial preparation. Your financial model isn’t just a spreadsheet—it’s the bridge between your vision and investor confidence. When investors evaluate thousands of deals annually, they fund clarity and conviction above all else.
The critical question becomes: what goes into an investor-ready financial model that secures investment? The answer lies in key interconnected elements that transform assumptions into actionable insights. From revenue projections tied to measurable drivers to scenario planning that demonstrates risk management, each component must work together to tell a compelling growth story. Ascent CFO Solutions helps founders build these investor-grade models that align strategy with funding success.
Defining the Investor-Ready Financial Model: Scope, Standards, and Structure
An investor-ready financial model definition centers on creating a comprehensive forecasting tool that translates your business strategy into auditable numbers. Investors must be able to trust and validate every assumption and projection. The foundation requires a modular structure built around integrated income statement, balance sheet, and cash flow projections, with dedicated tabs for assumptions, revenue drivers, operating expenses, capital expenditures, and executive outputs. This three-statement approach ensures changes flow through all financial statements automatically, while clear separation between inputs and calculations makes your model transparent during due diligence.
Beyond structural requirements, the operational standards that distinguish institutional-grade models from basic spreadsheet projections include rigorous version control, comprehensive audit trails, and a single source of truth that integrates with your existing systems. Investors expect a 5-year forecasting horizon with monthly granularity for the first 24 months, then quarterly detail thereafter—this timeline allows them to evaluate both near-term execution risk and long-term value creation potential. Your model should connect to your CRM, accounting system, and operational dashboards, ensuring investor expectations for data consistency and GAAP compliance are met from day one.
(1/15) Assumptions And Drivers: The Engine Of Your Model
Think of assumptions and drivers as the control panel for your entire financial model. Every revenue projection, cost estimate, and cash flow calculation should trace back to a specific, transparent input like pricing per unit, conversion rates, or sales cycle length. The FAST Standard recommends centralizing these drivers on dedicated input sheets rather than burying them in formulas. When investors question aggressive projections like 300% ARR growth in year two, you can point to clear assumptions about customer acquisition rates and average contract values instead of searching through complex formulas.
Your drivers must stand up to scrutiny, so base them on real data whenever possible. Use historical performance, pilot program results, or credible market comparables rather than aspirational guesses. EY’s startup modeling guide emphasizes validating assumptions with contracts, market research, and conversion data. When you lack solid data, flag those drivers as “TBD” with sensitivity ranges showing best and worst-case scenarios. Most importantly, institute change control so any shift in assumptions automatically flows through to show impacts on revenue, cash burn, and runway—because small changes in key drivers can extend or shorten your runway by months. Document your methodology using bottom-up analysis so investors can trace every projection to its source.
(2/15) Revenue Model: How Value Becomes Revenue
Your revenue model transforms customer interactions into predictable cash flows that investors can evaluate and trust. The best models map every step from initial lead contact through recurring revenue expansion, showing exactly how your business converts prospects into paying customers.
Building this foundation requires connecting your go-to-market strategy to financial outcomes through transparent assumptions about conversion rates, sales capacity, and pricing structures.
Map your complete acquisition funnel from lead sources through conversion, including realistic ramp times and capacity limits
Build cohort-based MRR/ARR models tracking logo churn, net dollar retention, and expansion revenue by customer segment
Model pricing tiers and payment terms showing how annual vs. monthly billing affects deferred revenue timing and cash flow
Separate recurring from non-recurring revenue to avoid revenue quality red flags that drive investors away
Stress-test revenue mix scenarios like 60/40 product vs. services splits to quantify impacts on margins and cash flow
Your revenue model becomes the bridge between your business strategy and financial projections. When investors see clear connections between customer acquisition costs, retention rates, and revenue growth, they gain confidence in your ability to scale predictably.
Investor-ready financial projections require integrated P&L, balance sheet, and cash flow statements with monthly granularity for the first 24 months. Your model must reconcile revenue recognition timing with actual cash collection, incorporating deferred revenue, accruals, and working capital mechanics rather than simple cash-basis estimates. This means modeling accounts receivable based on payment terms and tracking inventory turnover. You also need to forecast accounts payable tied to vendor payment cycles. Cash flow forecasting services help ensure these elements integrate seamlessly, providing the transparency investors demand during diligence.
Build base, upside, and downside scenarios using identical driver assumptions to enable direct comparison across cases. Each scenario should adjust key variables like conversion rates, pricing, and churn while maintaining the same underlying model structure. This approach allows you to demonstrate sensitivity to market conditions and operational execution while keeping projections anchored to measurable business drivers. Investors value this consistency because it shows you understand which levers actually move your business and can adapt quickly when conditions change.
(4/15) Unit Economics: Prove Each Customer Is Worth It
Unit economics answer the fundamental question every investor asks: does each customer generate more profit than they cost to acquire and serve? Your model must demonstrate this profitability at the individual customer level, segmented by your go-to-market approach.
These core metrics demonstrate profitability and guide strategic decisions that investors scrutinize closely. They drive your profitability narrative and show whether your business model can scale efficiently.
Calculate fully-loaded CAC including sales salaries, marketing tools, and allocated overhead—not just advertising spend
Target sub-12-month payback periods using gross margin, not revenue, to show true cash recovery timing
Model LTV using tracked cohort data from actual customer behavior rather than industry assumptions or averages
Show margin progression from current levels (e.g., 55%) to target efficiency (65-70%) as volume scales
Segment by customer type since enterprise and SMB customers have significantly different acquisition costs and lifetime values
Your unit economics must connect directly to your GTM strategy. Enterprise customers typically have higher CAC but longer payback periods, while SMB segments may show faster payback but higher churn. Model these dynamics separately to show investors you understand your customer segments and can optimize spend accordingly. These metrics also directly impact your cash flow timing, making accurate payback calculations essential for runway planning.
Strong unit economics prove your business model works before you scale it. They become the foundation for every growth decision and capital allocation choice in your investor-ready model.
(5/15) Cost Structure Analysis: Fixed, Variable, And Scalable
Effective cost structure analysis starts with separating costs into fixed expenses (rent, licenses, base salaries) and variable costs that scale with activity (materials, commissions, usage fees). Beyond basic categorization, identify step-function costs where expenses jump at specific thresholds—adding your first customer success manager, upgrading to enterprise software tiers, or meeting compliance requirements. These discrete cost increases can significantly impact margins and runway without proper modeling, making this analysis essential for investor-ready projections.
Link your staffing plans directly to productivity assumptions rather than treating headcount as a flat expense line. Model specific ratios like accounts per customer success manager, deals per account executive, or tickets per support agent to justify hiring decisions with operational capacity. Additionally, model vendor pricing tiers and usage-based fees explicitly—compute costs, payment processing, and software subscriptions often have breakpoints that can compress margins during rapid growth phases if not anticipated in your forecasts.
(6/15) Go-To-Market Strategy: Model What You Plan To Execute
Your go-to-market strategy becomes credible when it translates into measurable financial assumptions. Investors want to see how your ICP, channels, and sales motions connect to specific funnel metrics and capacity requirements.
Here’s how to transform your go-to-market strategy into concrete model inputs:
Map customer acquisition from lead sources through funnel stages, showing conversion rates and sales capacity constraints for each channel
Model realistic ramp curves with 60-95 days to quota attainment and territory saturation effects that limit marginal returns
Connect hiring plans to quota capacity, showing how each new sales hire maps to specific revenue milestones
Include retention metrics like net revenue retention and expansion rates that validate your lifetime value calculations
This approach transforms your GTM documentation from strategy slides into operational forecasts. When your model reflects what you actually plan to execute, investors can evaluate both your growth potential and execution capability with confidence.
(7/15) Cash Flow Forecasting: The Lifeline Of Runway
Cash flow forecasting separates surviving companies from those that run out of runway despite strong revenue growth. Direct method cash flow disclosures improve forecasting accuracy by capturing actual cash receipts and payments rather than estimating from income statements. Your model should reconcile cash projections to balance sheet changes in working capital, ensuring every dollar of projected cash ties back to specific balance sheet movements. This reconciliation catches timing gaps between revenue recognition and cash collection that can blindside growing companies.
Working capital changes create the most significant runway risks for scaling health tech companies. Small improvements in your cash conversion cycle, reducing DSO by five days or extending DPO by ten days—can extend runway by months without raising additional capital. Build a rolling 13-week cash forecast for operational control alongside your 60-month strategic model. The weekly granularity reveals payroll timing, vendor payment schedules, and seasonal patterns that monthly forecasts miss, giving you the visibility to make proactive decisions before cash blind spots become crisis situations.
(8/15) Capital Requirements: How Much, When, And Why
Getting your funding needs right means the difference between confident growth and scrambling for emergency funding. Smart founders build their capital needs from the ground up, not from wishful thinking.
Your capital requirements should reflect real operational needs, not round numbers that sound impressive to investors.
Calculate monthly burn from your staffing plan, operational costs, and milestone-specific expenses like regulatory approvals
Target 18-24 months of runway, extending to 24-36 months in tighter fundraising markets
Layer equity, venture debt, and grants with realistic timing gaps between funding sources
Add 10-20% buffers for delays, cost overruns, and market volatility
Model dilution impact and debt covenants using robust cash flow forecasts before committing to funding structures
The best capital plans tie every dollar to measurable milestones and account for the reality that fundraising takes months, not weeks. Build your requirements with precision, then execute with discipline.
(9/15) Use Of Funds: Turn Capital Into Milestones
Investors fund milestones, not burn rates. Your use of funds should break capital into specific initiatives, like hiring plans, clinical studies, platform enhancements, and market entry rather than vague categories. For example, instead of “$2M for R&D,” specify “$800k for preclinical efficacy studies over 8 months, $600k for regulatory consulting and IND preparation, and $400k for medicinal chemistry lead optimization.” This approach, emphasized in milestone-based funding, shows investors exactly what each dollar will accomplish and when.
Create a plan that unlocks capital as you de-risk key assumptions and hit measurable KPIs. Structure your funding around 18-24 months of runway to meaningful inflection points, with clear deliverables tied to specific dates and success criteria. Map each tranche to targets investors can track, such as “achieve 100 pilot customers by month 12” or “complete Phase I enrollment by quarter 6.” This milestone approach demonstrates disciplined capital allocation while giving investors confidence that funds will drive measurable progress toward your next value-creation event.
(10/15) Break-Even Analysis: Path To Self-Sufficiency
Break-even analysis turns your financial model into an operational compass. It shows investors you understand the precise volume thresholds where your business becomes self-sustaining and reveals your path to profitability.
Calculate contribution margin thresholds using fixed costs divided by unit profitability
Model full-company breakeven, including all overhead, not just direct product costs
Test sensitivity scenarios for 10-20% changes in price, churn rates, and customer acquisition costs
Set volume-based hiring gates tied to contribution margin coverage of new headcount costs
Use profitability thresholds as marketing spend guidelines to prevent runway burn
This analysis becomes the bridge between growth ambitions and financial discipline.
The U.S. Small Business Administration recommends adding a 10% buffer to your calculations to account for unexpected expenses. Yale’s business school emphasizes using these metrics as decision-making constraints rather than just calculation exercises.
For health tech companies, the analysis must account for regulatory costs, clinical validation expenses, and longer sales cycles typical in healthcare. Model both unit profitability thresholds (covering direct costs) and full company profitability (including R&D, compliance, and overhead) to give investors confidence in your path to self-sufficiency. As noted in our guide on financial forecasts, this analysis works best when integrated with rolling cash flow forecasting and scenario planning.
The sensitivity analysis component is particularly valuable for investor discussions. Show how a 15% improvement in customer acquisition cost or a 10% reduction in churn accelerates your profitability timeline. This demonstrates you understand the levers that matter most and can adapt quickly when market conditions change. Investors want to see that you’ve identified the fastest path to self-sufficiency and built operational discipline around those metrics.
(11/15) Scenario Planning: Prepare For The What-Ifs
Effective scenario planning starts with building three core cases that share the same driver structure while varying key assumptions. Your Base case reflects most likely outcomes using historical conversion rates and realistic growth targets. The Upside scenario models aggressive but achievable growth with higher win rates, faster customer ramp, and lower churn. The Downside case examines conservative assumptions like reduced conversion rates, extended sales cycles, and increased customer churn. Leading practitioners recommend focusing on 3-5 variables that most impact your financial outcomes, ensuring each scenario tells a coherent story rather than random number adjustments.
Pre-planning specific actions for each scenario transforms your model from a spreadsheet into an operational playbook. Document hiring gates, spend throttles, and pricing levers tied to each case so leadership can execute immediately when conditions change. Advanced scenario analysis should include customizable forecast dashboards with scenario toggling, enabling real-time pivots during board meetings or investor discussions. Building decision-driving forecasts with startup-focused approaches emphasizes building these toggles into assumption sheets so changing one input automatically updates all connected outputs across your income statement, balance sheet, and cash flow statement.
(12/15) Sensitivity Analysis: Expose The Levers That Matter
Sensitivity analysis transforms your static model into a dynamic decision-making tool. It identifies which assumptions most influence your outcomes and quantifies the impact of changes on your runway and growth trajectory.
Run one-variable tests on price, churn rate, and CAC to measure individual impact on ARR and cash runway
Test two-variable combinations like pricing versus churn or CAC versus conversion rates for interaction effects
Create tornado charts ranking your top five drivers by potential variation in outcomes on key metrics
Maintain 95% data cleanliness standards across input datasets to ensure reliable sensitivity outputs
Highlight your three most influential value drivers prominently in investor presentations and board materials
Sensitivity analysis helps investors understand which levers you can pull to accelerate growth or extend runway. When building investor-grade models with sensitivity scenarios, focus on the variables that create the biggest swings in your key metrics rather than testing every assumption in your model.
Your key performance indicators (KPIs) transform your financial model from a static projection into a dynamic management tool by creating measurable checkpoints that validate assumptions and trigger strategic adjustments. Select a balanced mix of leading and lagging indicators that tell your growth story: pipeline coverage and activation rates predict future performance, while net retention, CAC payback, and gross margin validate execution. Health tech companies should track sector-specific metrics like patient acquisition costs and clinical milestone completion alongside standard metrics like burn multiple and cash runway.
Once selected, operationalize these metrics through live dashboards that surface forecast variances in real time, enabling monthly course corrections before small deviations become major problems. Research shows that companies tying leadership incentives to KPI targets achieve nearly five times higher total shareholder returns than those without structured accountability. Create clear KPI definitions with explicit formulas, assign ownership for each metric, and establish monthly review cycles that connect performance to strategic decisions.
(14/15) Exit Strategy: Keep The End In Mind
Your financial model isn’t just about getting funded—it’s about positioning your company for the right exit at the right valuation. Smart founders plan multiple exit paths early and work backward from their target outcome to ensure every financing decision supports their ultimate goal.
Forecast both strategic M&A and IPO scenarios with the specific metrics buyers value in your industry
Back-cast from your target valuation to identify required milestones over the next 24–60 months
Structure your cap table and financing rounds to preserve maximum exit optionality and stakeholder alignment
Incorporate business model maturity timelines, as exit modes vary with how developed your market category becomes
Avoid debt structures that constrain strategic flexibility, since long-term external debt reduces acquisition likelihood
Remember that exit preparation should start 12–24 months before you go to market. Your model becomes the foundation for demonstrating the path from current performance to exit-worthy metrics, giving potential buyers or M&A advisors confidence in your trajectory.
(15/15) Investor Presentation Readiness: From Model To Story
Your financial model becomes compelling when it tells a coherent story that investors can follow in under two minutes. Investors scan pitch materials quickly, so your narrative must connect problem to solution to traction to unit economics to capital plan in a logical flow. Start with your 30-second hook highlighting your top metrics, then walk through how customer acquisition costs translate to lifetime value, how your revenue model scales, and exactly how invested capital accelerates growth milestones. This storytelling approach transforms spreadsheet rows into a compelling investment thesis.
Beyond the narrative, investor presentation readiness requires a complete source-of-truth package that includes your model, assumptions book, KPI dashboard, and organized data room. Practice answering the four big questions investors always ask: how you grow, what it costs, how fast you learn, and how risk is managed. Run sensitivity analyses on your key drivers, prepare base and downside scenarios, and ensure your pitch deck financials reconcile perfectly with your detailed model. Plan to have this complete package ready within 30-60 days of active fundraising, as investors expect immediate access to supporting documentation during due diligence.
Investor-Ready Financial Model FAQs
Building an investor-ready model raises practical questions about structure, timing, and presentation. These answers address the most common concerns founders face when preparing models that meet investor expectations and support successful fundraising.
How detailed should my model be for seed vs. Series A vs. Series B?
In general, seed stage requires basic projections with quarterly granularity and simple unit economics. Series A demands monthly detail for Year 1, cohort analysis, and defensible assumptions. Series B expects GAAP-compliant statements with variance analysis, sophisticated KPI tracking, and scenario modeling that demonstrates operational maturity.
What timeline granularity do investors expect—monthly, quarterly, or both?
Investors expect monthly detail for the first 12-24 months, then quarterly projections extending 3-5 years total. Monthly granularity shows operational control and cash management discipline. Quarterly views demonstrate long-term strategic thinking while remaining realistic about forecasting limitations beyond the near term.
Do I need a 13-week cash forecast if I already have a 60-month model?
Yes. The 13-week forecast provides operational cash management precision that 60-month projections cannot deliver. Weekly granularity reveals timing gaps, payment delays, and working capital needs. Monthly closes within 5-10 business days combined with rolling 13-week views demonstrate financial discipline investors expect.
How do I validate assumptions without years of historicals?
Use market research, pilot programs, and comparable company data to support projections. Document assumption sources clearly and show sensitivity ranges around uncertain inputs. Experienced fractional CFOs help founders identify credible benchmarks and structure defensible assumptions that investors trust over optimistic guesses.
What’s the difference between scenario planning and sensitivity analysis?
Sensitivity analysis tests single variable changes (price, churn rate) for immediate tactical insights. Scenario planning models multiple interacting variables across base, upside, and downside cases for strategic decisions. Use sensitivity analysis first to identify key drivers, then build scenarios around those critical variables.
How often should I update the model, and who owns it internally?
Update monthly during active fundraising and quarterly for ongoing investor relations. The CFO or finance lead should own the model with input from sales, marketing, and operations teams. Rolling forecasts with consistent methodology ensure accuracy and enable real-time decision-making as assumptions evolve.
What are the most common red flags investors see in models?
Revenue quality issues, unrealistic growth assumptions, missing cash flow detail, and inconsistent metrics across materials. Overoptimistic projections without supporting data immediately undermine credibility. Investors also flag models lacking scenario analysis, unclear unit economics, and poor presentation organization.
How should I present use of funds and milestones in a pitch?
Map each dollar to specific value-creation milestones with measurable outcomes and clear timelines. Show how capital accelerates growth, extends runway, or de-risks assumptions. Present base case in the deck with detailed tranche structures in your data room. Link milestones to KPI improvements and next funding requirements.
What KPIs matter most in health tech compared with other sectors?
Health tech emphasizes regulatory milestone progress, patient acquisition cost, time to clinical endpoint, and reimbursement approval rates alongside standard SaaS metrics. Focus on user engagement, clinical efficacy measures, patient outcome data, and compliance costs. Customer acquisition often involves longer sales cycles and higher regulatory requirements than typical B2B software models.
Build With Confidence: Turn Your Model Into Momentum
An investor-ready financial model isn’t just a spreadsheet—it’s your strategic compass. The 15 components we’ve covered transform assumptions into actionable insights that guide hiring decisions, pricing strategies, and capital allocation. When your model integrates unit economics with scenario planning and feeds real-time dashboards, you’re not just preparing for investors—you’re building the financial foundation for sustainable growth.
The difference between a static presentation and a dynamic decision-making tool lies in expert implementation and ongoing refinement. Fractional CFO services for startups bridge this gap by providing the tactical financial leadership needed to operationalize your model. Instead of creating models that sit unused after fundraising, experienced fractional CFOs help you track cash runway, monitor KPI variances, and adjust your approach based on real performance data. For health tech companies, this means aligning complex revenue recognition with investor expectations while maintaining compliance.
Ready to transform your financial model from a fundraising requirement into a growth engine? Ascent CFO Solutions can audit your existing model or build a comprehensive investor-ready framework tailored to your company’s unique needs and growth trajectory.
A 13-week cash flow model provides essential weekly visibility into your business’s liquidity, enabling proactive management of cash during periods of growth, seasonality, or operational complexity.
This forecasting approach aligns with natural business cycles and creates a disciplined, rolling process that helps prevent cash surprises and supports confident, data-driven decisions.
Implementing a 13-week cash flow model is especially valuable for companies facing rapid growth, unpredictable collections, or lender requirements, and can be effectively managed by a CFO or Fractional CFO.
Your profit-and-loss statement might show healthy margins, but your bank account tells a different story. Cash gets tight long before financial statements reveal trouble, leaving even profitable companies struggling to maintain consistent payroll timing. This timing gap between earning revenue and collecting cash has blindsided countless growing businesses.
Most companies discover this reality during their first cash squeeze, which is precisely when the question “Do we need a 13‑week cash flow model?” becomes urgent. A 13-week cash flow model transforms this reactive scramble into proactive leadership control. It gives you weekly visibility into liquidity, timing, and trade-offs that keep growth sustainable and help companies stay strategic during challenging periods.
Ready to turn cash surprises into strategic decisions? Ascent CFO Solutions helps growing companies implement comprehensive forecasting models that scale with their ambitions.
The Strategic Case: Why 13 Weeks Is the Right Horizon for Growing Businesses
Most growing companies have enough revenue but struggle with when cash actually arrives versus when bills are due. The benefits of a 13-week cash flow model for startups and scale-ups become clear when you realize this horizon perfectly matches how your business actually operates.
Operating Cycles Drive the 13-Week Sweet Spot
Your business runs on predictable cycles that repeat within a 13-week period. Customer collections typically span 30-90 days, payroll hits every two weeks, and inventory turns happen monthly or quarterly. As Yale School of Management research demonstrates, these working capital cycles create scheduling mismatches between when you book revenue and when cash actually arrives. A 13-week window captures these full cycles, giving you enough visibility to see problems coming and enough time to act.
This Operational Alignment Becomes Actionable Through Weekly Decision Cadence
The weekly structure of a 13-week model forces decisions that monthly forecasts often miss. EisnerAmper’s analysis shows how weekly granularity surfaces mid-month cash crunches that could derail payroll or vendor payments. When you can see that Week 7 will be tight, you make different choices about hiring in Week 3, inventory purchases in Week 5, or vendor payment coordination. This granular view transforms vague cash concerns into specific, actionable decisions.
Rolling Updates Transform Reactive Management Into Strategic Rhythm
The strategic advantage becomes clear when your 13-week model becomes a rolling process. Each week, you compare forecasts with actuals to identify gaps, update assumptions, and add Week 14 to maintain constant forward visibility. This weekly rhythm shifts your leadership team from fighting cash fires to making proactive decisions about growth investments, vendor negotiations, and financing sequencing. Comprehensive forecasting models help finance, operations, and sales start speaking the same language about cash impact and coordination.
What Is a 13-Week Cash Flow Model? Definition, Structure, and Cadence
A 13-week cash flow model is a weekly forecast that tracks actual cash coming in and going out of your business over the next three months. Unlike traditional financial statements that include non-cash items like depreciation, this model focuses purely on cash receipts and disbursements. The 13-week timeframe covers one fiscal quarter, giving you enough visibility to make informed decisions while staying accurate enough for weekly planning.
To build this visibility, the model pulls data from multiple sources across your business: accounts receivable aging reports show when customers will pay, accounts payable schedules reveal vendor payment timing, and payroll calendars show payroll timing. Sales pipeline data reveals when deals will close and payments arrive, while inventory purchase plans and debt service schedules complete the cash picture. What makes these models powerful is their rolling nature – each week, you replace forecasted numbers with actual results, update your assumptions, and add week 14 to maintain continuous 13-week visibility. This weekly rhythm transforms cash management from reactive scrambling into proactive cash flow forecasting, giving leaders the financial visibility needed to protect payroll and growth investments.
Who Needs a 13-Week Cash Flow Model? Triggers and Fit by Stage
Every company can benefit from weekly cash visibility, but certain growth patterns and operational realities make a 13-week model invaluable. The question isn’t whether you can afford to implement one, but whether you can afford the surprises that come without it.
Growth-stage companies experiencing working capital stress should adopt the model before cash gets tight. When your business faces longer supplier lead times, larger purchase orders, or lumpy enterprise deals that create unpredictable collections, weekly visibility prevents growth from outpacing your ability to fund operations.
Companies with seasonal revenue swings or irregular cash patterns benefit from weekly forecasting to protect payroll and maintain vendor relationships. Whether you’re managing seasonal fluctuations in construction or dealing with subscription churn, the 13-week model gives you advance warning to secure financing or adjust spending.
Founder-led teams transitioning from hands-on to systematic operations use the model to align finance decisions with sales, operations, and procurement. As your company scales beyond what you can manage intuitively, the weekly forecast becomes the strategic planning tool that keeps all departments working from the same cash reality.
Companies approaching $2-$10 million in revenue typically hit the growth stage where monthly financial statements aren’t enough. At this stage, cash flow management becomes more sophisticated than tracking your bank balance, and weekly visibility prevents small timing issues from becoming payroll challenges.
Businesses preparing for fundraising, acquisition, or debt financing need the model to demonstrate financial discipline to investors and lenders. The 13-week forecast shows you can manage liquidity proactively rather than reactively, which builds confidence in your ability to scale responsibly with comprehensive forecasting models.
Growing companies often wonder whether they need the discipline of weekly cash forecasting or if monthly snapshots are sufficient. These questions address the practical decisions around timing, implementation, and ownership that business leaders face when considering more structured liquidity management.
How do you know if your business needs a 13-week cash flow model?
Your business needs a 13-week model when growth stresses working capital, collections become unpredictable, or you experience cash timing issues despite strong revenue. According to the AICPA, cash flow forecasts are essential for monitoring liquidity when risks are heightened. If you’re making reactive decisions about vendor payments or hiring timing, you need weekly visibility.
When should a company implement a 13-week cash flow forecast?
Implement before cash gets tight, not after. CBIZ research shows companies often wait until lenders require forecasts during financial stress. The optimal time to implement is when you hit $2-10M revenue, add complexity like multiple entities or debt, or shift from founder-led to systematic processes. The model prevents surprises rather than reacting to them.
Who is responsible for managing a 13-week cash flow model in a growing business?
The CFO-level financial leadership owns the process, with input from operations, sales, and procurement teams. GTreasury notes that CFOs and finance heads typically drive forecast processes because controllers often lack strategic forecasting skills. For growing companies without full-time CFOs, a Fractional CFO can establish and maintain the model or train internal teams.
What happens if you skip implementing a structured cash forecast?
You risk payroll timing issues, missed vendor payments, and reactive decision-making that constrains growth. Companies often discover cash problems too late when relying on bank balances or monthly reports. Professional cash flow forecasting prevents operational disruption and maintains stakeholder confidence during growth phases.
How often should you update a 13-week cash flow forecast?
Update weekly, rolling forward one week each cycle. The Controllers Council emphasizes that 13 weeks is long enough to spot trends but short enough to correct course quickly. Weekly updates and comparisons to actual results keep assumptions fresh, integrate actual results, and maintain the discipline needed for accurate liquidity planning.
Next Steps: Implement, Operationalize, and Scale With Confidence
A 13-week cash flow model transforms liquidity from reactive fire drills into proactive leadership decisions. Companies that stand up rolling forecasts gain weekly visibility into cash timing, enabling smarter choices about hiring, vendor payments, and growth investments before cash gets tight.
The path forward is clear: build a rolling weekly model, establish a weekly cash meeting rhythm, and integrate your AR, AP, payroll, and pipeline data into a single, integrated forecasting platform. This operational discipline separates growing companies that scale confidently from those that struggle when cash flow blind spots create unexpected shortfalls.
Ready to strengthen your liquidity planning? Ascent CFO Solutions delivers comprehensive cash flow forecasting for scaling businesses, helping you build the rolling models and weekly governance that turn cash visibility into competitive advantage.
Focusing on a select set of actionable KPIs—such as conversion rate, customer acquisition cost, and contribution margin—is essential for scalable and profitable ecommerce growth.
Integrating data sources and establishing a single source of truth enables real-time insights, more accurate forecasting, and confident decision-making across all business functions.
Disciplined, regular review of KPIs at operational and strategic levels empowers ecommerce companies to proactively adjust strategies, optimize spend, and avoid costly mistakes from fragmented or delayed reporting.
Most ecommerce companies drown in data but starve for insights. Growth stalls not from lacking metrics, but from tracking vanity metrics that disconnect from profit and cash flow. The difference between scaling sustainably and burning through runway lies in choosing the right performance indicators.
The solution requires strategic focus. What KPIs should an ecommerce company track?, The answer demands linking traffic quality, conversion efficiency, contribution margin, and retention into a single source of actionable insights. This guide delivers a CFO-grade framework for the fifteen metrics that directly influence budgeting, forecasting, and scalable growth decisions while avoiding the costly mistakes of delayed reporting.
Partner with Ascent CFO Solutions to build the KPI dashboard that transforms your data into profitable growth strategies.
Defining Ecommerce KPIs That Drive Scalable Growth
Building an effective ecommerce KPI framework starts with mapping metrics to your growth engine: acquire, convert, fulfill, and retain customers. Each KPI must directly impact contribution margin and cash flow, not vanity metrics that look impressive but don’t drive decisions. As Fast Slow Motion recommends, choose a single North Star metric like revenue per visit, then select 3-6 driver KPIs that explain performance across your entire customer journey from first click to repeat purchase.
Successful ecommerce companies adopt a review schedule that matches decision-making needs. Weekly reviews focus on granular operational KPIs like traffic and conversion rates, while monthly sessions examine strategic metrics such as customer acquisition cost and lifetime value trends. Quarterly assessments present board-level performance against growth targets and cash projections. Before scaling any marketing spend, integrate systems across ads, web analytics, ERP/OMS, and accounting to create a single source of truth that eliminates conflicting data and enables confident investment decisions.
(1/15) Conversion Rate Optimization: Turn Visitors Into Customers
Blended conversion rates mask performance gaps that drain marketing budgets. Desktop converts at roughly 1.7x the rate of mobile, while returning customers convert 2-5x higher than first-time visitors. Track these segments separately to identify where your funnel breaks down. Industry benchmarks range from 1.4% for home and furniture to 4.9% for food and beverage, but your traffic mix determines what’s realistic for your business.
Focus improvement initiatives on fixes that move the needle fastest. Checkout speed tops the list since increasing page load from one to five seconds raises bounce probability by 90%. Add clear trust signals, transparent shipping costs, and simple return policies to reduce hesitation at purchase. Set a threshold to close your gap-to-benchmark by 10-20% before scaling ad spend, ensuring each dollar works harder as traffic increases.
(2/15) Customer Acquisition Cost: Spend With Discipline
Customer acquisition cost determines your growth sustainability. Calculate it wrong, and profitable channels look unprofitable while unprofitable channels seem viable.
Most companies track only direct ad spend, missing the true cost of acquisition. Growth-focused companies include every dollar spent to win customers and use that data to make disciplined budget decisions.
Focus on these fundamentals:
Include agency fees, creative costs, and marketing overhead in your fully-loaded CAC calculation
Track CAC by channel to identify which sources deliver sustainable customer economics
Throttle spend when your LTV:CAC ratio drops below 3:1 or payback exceeds targets
Reallocate budget weekly toward channels with superior retention and contribution margins
Disciplined CAC management prevents the common trap of scaling unprofitable growth. When acquisition costs exceed your acceptable thresholds, proper forecasting helps you pivot spend before burning cash.
(3/15) Average Order Value: Increase Basket Size Strategically
Average order value represents one of your most controllable levers for revenue growth without increasing customer acquisition costs. Tiered free shipping thresholds set approximately 30% above your current AOV encourage larger baskets while protecting margins. Product bundles and complementary upsells work best when they add genuine value rather than simply pushing higher prices. Test these margin-aware tactics methodically before scaling to avoid training customers to wait for promotions.
Smart segmentation reveals where to focus your AOV optimization efforts most effectively. Direct traffic consistently produces the highest average order values at $114.78, followed closely by email and search channels, while social traffic converts at significantly lower order values. Target your highest-intent channels with premium bundles and cross-sells, then model these improvements directly into your ROAS targets and inventory planning to maintain cash flow alignment.
(4/15) Customer Lifetime Value: Monetize Over the Long Run
Customer lifetime value becomes your north star for sustainable growth when calculated correctly. Most companies get this wrong by using revenue instead of actual profit margins.
Accurate CLV calculation drives better budget decisions and prevents the costly mistake of scaling unprofitable customer acquisition. Focus on these three areas to maximize long-term customer value:
Calculate CLV using contribution margin multiplied by customer lifetime, not gross revenue totals
Track cohort retention rates monthly to spot early warning signs of declining customer lifetime value
Deploy welcome sequences and 30-day repurchase campaigns to shorten payback periods
Set acquisition spend limits when CLV:CAC ratios drop below 3:1 thresholds
Prioritize product lines and channels that generate customers with proven repeat behavior
Companies like Klaviyo report 14-month payback periods by measuring contribution margin recovery against marketing spend. Follow this same discipline in your LTV tracking to guide budget allocation and product decisions, and avoid the red flags that undermine growth stories.
(5/15) Cart Abandonment Rate: Rescue Intent at Checkout
Cart abandonment rate reveals where purchase intent meets friction in your checkout flow. The global average sits at 70.22%, but mobile abandonment runs significantly higher at 79.61% compared to desktop’s 67.29%. This device gap signals specific optimization opportunities: mobile-first checkout design, faster load times, and simplified forms. Track abandonment by traffic source and device using tools like Ascent CFO Solutions’ KPI tool for ecommerce companies to identify your largest revenue gaps and prioritize fixes.
Deploy triggered recovery emails within 30-60 minutes of abandonment when purchase intent remains strongest. Academic research confirms these campaigns increase online revenues, with roughly one-third of email clicks converting to purchases. Test incentive offers carefully to avoid training customers to abandon for discounts. Focus first on removing friction: 39% abandon due to unexpected costs and 19% due to forced account creation. Enable guest checkout, wallet payments, and display total costs upfront. Consider implementing custom dashboards to track abandonment patterns and recovery performance across channels.
(6/15) Gross Profit Margin: Protect Unit Economics
Your gross profit margin reveals whether each sale actually contributes to growth or quietly erodes profitability. Most ecommerce companies track blended margins that hide SKU-level losses and channel inefficiencies.
Calculate true COGS by SKU including landed costs, packaging, and handling fees to surface hidden losers
Track margins by traffic source and device to identify which channels deliver profitable customers versus price-sensitive customers
Set minimum contribution margin thresholds before scaling paid acquisition or launching promotions
Review SKU profitability monthly to discontinue or reprice products that fail to meet targets
Tie promotional calendars to inventory turns rather than arbitrary discount schedules that erode pricing power
Protecting margins at the SKU and channel level prevents profitable growth from becoming unprofitable scale. When you present margins by product line, you can make data-driven decisions about where to invest and where to pull back.
(7/15) Return on Ad Spend: Align Revenue and Efficiency
Return on ad spend becomes misleading when you rely solely on platform-reported numbers. Research shows that different attribution methods can shift ROAS by up to 63% across campaigns. Track both your platform ROAS and Marketing Efficiency Ratio (MER) to capture the full picture. MER calculates total revenue divided by total marketing spend, giving you a blended view that accounts for cross-channel effects and attribution gaps.
Beyond attribution challenges, revenue-only ROAS can hide unprofitable campaigns by ignoring your actual costs per order. Calculate contribution-margin return on ad spend using gross profit after variable costs instead of raw revenue. This approach reveals whether campaigns generate real profit, not just top-line growth. Set different ROAS targets by funnel stage since prospecting campaigns naturally show lower immediate returns than retargeting. Case studies demonstrate that accepting negative first-order margins for new customers can drive 140% revenue growth when lifetime value supports the strategy. Just like fully-loaded CAC calculations, contribution-margin ROAS prevents you from scaling unprofitable channels.
(8/15) Inventory Turnover Ratio: Balance Stock and Cash
Your inventory turnover ratio reveals how efficiently you convert stock into sales and working capital. Poor turns signal capital trapped in slow-moving products that drain liquidity and increase markdown risk.
Smart inventory management requires category-level visibility and proactive reorder policies. Focus on these tactical approaches:
Track turnover by SKU and category to identify slow movers that tie up cash and increase markdown risk
Build rolling forecasts with lead-time buffers to set reorder points without overstocking safety inventory
Schedule promotions around aging inventory to accelerate turns before markdowns become necessary
Integrate demand forecasts with procurement timing to optimize working capital without compromising service levels
Set minimum turn thresholds by category and pause reorders when inventory exceeds target levels
Companies using advanced data analysis for inventory optimization report turnover improvements from 2.5 to 3.0 times annually. As experienced fractional CFOs emphasize, inventory turn is a core metric that directly impacts cash conversion cycles and reduces the risk of obsolete inventory write-offs that can swing purchase price by 10-20% during company sales.
Effective inventory turnover management requires integrating rolling forecasts with procurement policies and promotional calendars. This coordination prevents capital from getting trapped in slow-moving stock while maintaining the service levels your customers expect.
(9/15) Repeat Purchase Rate: Build Habit, Not One-Offs
Repeat purchase rate reveals whether you’re building a sustainable business or just handling one-time sales. Track repurchase behavior in 30, 60, and 90-day windows by customer cohort to identify onboarding gaps and retention issues early. Research shows that customer satisfaction has strong relationships with repeat purchases, but satisfaction varies significantly across customer segments. Your KPI dashboard should segment repeat rates by acquisition channel, product category, and customer type to pinpoint which cohorts convert from one-time buyers to loyal customers.
Building on these measurement insights, deploy replenishment reminders and subscription options to create predictable cash flows from repeat business. Subscription models show that CAC recovery often takes multiple months, making retention the key to profitability. Focus CRM investments on tactics that lift repeat purchase margin, not vanity metrics like email opens. CRM integration that emphasizes personalization and service responsiveness significantly increases both loyalty and retention, creating measurable improvements in repeat purchase behavior.
(10/15) Net Promoter Score: Predict Retention With Experience
Most ecommerce companies collect Net Promoter Score too early, missing the complete customer experience that drives actual retention behavior. Research shows that individual promoter scores reliably predict actual online word-of-mouth behavior, but only when collected after customers experience your full service delivery. Here’s how to make NPS predictive of customer retention:
Collect NPS post-delivery to capture shipping speed, packaging quality, and product satisfaction in one retention-predictive score
Route detractors immediately to service recovery teams while memories are fresh and retention is still recoverable
Engage promoters systematically for user-generated content, reviews, and referral program participation
Segment NPS by SKU to identify which products drive loyalty versus one-time purchases
Track NPS by carrier and delivery metrics including delivery time, damage rates, and packaging quality scores
The most actionable NPS programs, combine the score with operational data to pinpoint exactly what drives customer retention versus churn. This correlation reveals whether retention issues stem from product quality, fulfillment speed, or packaging experience, enabling targeted improvements that directly impact repeat purchase rates.
(11/15) Website Traffic Sources: Allocate Budget to What Works
Not all website traffic sources deliver equal value to your bottom line. Research shows that customers cluster into distinct segments based on channel usage and purchase behavior, making it crucial to segment your traffic by channel and campaign. Track conversion rates, average order value, and contribution margins for each source rather than treating all visitors the same. Social media traffic might convert at 1.2% while email converts at 4.8%, but if social delivers higher AOV and repeat purchase rates, the unit economics tell a different story. As we discuss in our guide on building scalability, website traffic becomes a vanity metric unless tied to meaningful financial outcomes.
Attribution models reveal that last-click attribution systematically under-credits upper-funnel channels that assist conversions. A customer might discover your brand through a Facebook ad, research on Google, and purchase via email—but last-click gives email all the credit. Use data-driven insights to track assisted conversions and shift budget weekly toward channels that deliver superior post-purchase retention and lifetime value.
(12/15) Order Fulfillment Rate: Deliver on the Promise
Your order fulfillment rate directly impacts customer retention and cash flow. Perfect orders depend on four components working together.
Track perfect order rate including on-time delivery, complete shipment, damage-free product, and accurate documentation
Target 90%+ perfect orders as your baseline, with best-in-class operations achieving 97-99% across components
Measure delivery consistency not just speed—customers notice when delivery windows are unpredictable and unreliable
Audit pick-pack-ship bottlenecks weekly using throughput metrics like picks per hour and line-item fill rates
Implement proper product identification with scannable barcodes and consistent packaging standards to reduce mis-picks and damage
Churn rate means different things depending on your business model. Subscription businesses track customers who cancel recurring orders, while one-time purchase stores measure customers who stop buying within typical buying cycles. Track churn by cohort rather than overall averages to spot patterns early. Cohort-based tracking reveals which customer groups churn faster and helps you model the cash impact on revenue forecasts. This makes churn rate one of the core KPIs for scaling e-commerce companies.
Deploy win-back flows with time-bound offers to re-engage lapsed customers without training them to expect discounts. Cap incentives at 10-15% and set clear expiration dates to protect margins. Use cancellation surveys to understand why customers leave, then feed those insights back into product improvements and messaging. These insights create a cycle that reduces future churn at the source.
(14/15) Mobile Commerce Performance: Optimize the Primary Channel
Mobile commerce performance represents your largest revenue channel but often your biggest conversion leak. With mobile accounting for over 72% of ecommerce traffic yet converting at just 2.1% versus desktop’s 3.5%, optimizing this channel directly impacts your cash conversion and growth forecasts.
Implement thumb-friendly design with 44px minimum touch targets and simplified product pages for easier navigation
Establish device-specific KPIs including mobile conversion rate, mobile AOV, and payment method completion rates
Mobile optimization directly affects your unit economics and cash flow projections because mobile represents your primary customer acquisition channel. Close the mobile-desktop conversion gap by even one percentage point, and you can significantly improve your contribution margin without increasing acquisition spend.
(15/15) Cost of Goods Sold: Know Your True Costs
Your cost of goods sold calculation must capture the complete picture, not just purchase price. Include landed costs like freight, customs duties, packaging materials, and variable fulfillment expenses. Many ecommerce companies miss smaller items like shipping labels, handling fees, and payment processing costs that quietly erode margins. These hidden components can reduce gross profit by 2-5% without proper tracking.
Standard costs become outdated quickly as supplier prices, shipping rates, and duty structures change. Review and update your cost assumptions quarterly to prevent margin drift from stale data. Connect COGS accuracy directly to your pricing strategy and promotional calendar—detailed cost tracking helps you avoid running promotions that push products below profitability thresholds. When costs shift but prices stay fixed, every sale chips away at your contribution margin.
Ecommerce KPI FAQs
Fast-growing ecommerce companies face critical decisions about KPI governance, benchmarking, and system integration. These answers address the most pressing questions CEOs ask when scaling their data-driven decision making.
How often should we review KPIs at different organizational levels?
Operations teams should review conversion rates, traffic sources, and fulfillment metrics daily or weekly for tactical adjustments. Executive teams need monthly KPI reviews focusing on unit economics, cash flow, and growth trends. Board presentations should feature quarterly KPI summaries with year-over-year comparisons and strategic insights.
What are realistic benchmarks for key ecommerce metrics?
Industry data shows average conversion rates around 2.9% overall, with mobile at 2.8% and desktop at 3.2%. CAC payback should occur within 1-3 orders depending on your model. ROAS targets vary by channel, with prospecting campaigns typically requiring lower thresholds than retargeting efforts.
How do we create a single source of truth across all systems?
Connect your advertising platforms, web analytics, order management system, ERP, and accounting software through integrated dashboards. This eliminates data silos and ensures consistent metric definitions across teams. Prioritize your highest-impact KPIs first, then expand systematically to maintain data quality and team adoption.
Which KPIs belong on board decks versus daily dashboards?
Daily dashboards should track operational metrics like conversion rates, traffic sources, inventory levels, and order fulfillment rates. Board decks require strategic KPIs including customer lifetime value, contribution margins, cash conversion cycles, and rolling forecasts. Focus board presentations on trends and variance explanations rather than raw numbers.
When should we adjust KPI targets and thresholds?
Adjust targets quarterly for seasonality patterns, immediately for supply chain disruptions, and within 30 days of new product launches. Seasonal forecasting helps predict demand shifts, while rolling forecasts accommodate unexpected changes. Building strong foundations for scalability ensures your KPI framework adapts effectively to business changes.
Turn KPIs Into Scalable Growth
The difference between growing companies and scaling companies lies in their approach to measurement. Growing companies track everything and react to yesterday’s data. Scaling companies choose a focused set of KPIs, integrate their systems for real-time visibility, and establish a weekly cadence that turns insights into immediate action. Your ecommerce KPI strategy transforms conversion rates into budget allocation decisions and CLV data into acquisition spending thresholds.
Success requires discipline in both selection and execution. Scale only when your contribution margins and payback thresholds justify the investment. Build integrated systems and dashboards that surface unit economics alongside traffic metrics. Most importantly, avoid the costly delays that come from manual reporting and fragmented systems. The companies that scale successfully move from hindsight to foresight by treating their KPI framework as a competitive advantage.
Ready to transform your metrics into a growth engine? Ascent CFO Solutions can design your KPI dashboard and forecasting model to align with your unit economics and cash flow needs.