


Many CEOs and company leaders know that there is a wealth of data within their organization that can help them gain essential insights to guide their company’s growth. So why does this data so often go underutilized? Why aren’t more leaders able to effectively use their organizational data to help them confidently make business decisions?
In this article, we tackle three problems that hold companies back from harnessing the power of their data and identify solutions to help company leaders finally make their data useful and actionable for growing their business.

Problem #1: You’re only looking backward. You can’t see what’s happening right now or what is likely to happen in the future.
A CEO of a $22 million wealth management company once remarked to us, “I know the data is there, but I never feel like I have the right data, at the right time, in the right place.” Can you relate?
Common places that leaders look for decision-making insights are financial statements (balance sheet, income statement, and cash flow statement). Companies with experienced bookkeepers and/or controllers can likely feel confident that their accounting is complete and accurate. However, this isn’t enough information for CEOs who are expected to operate in a fast-paced environment. Financials can take a long time to close, and they only look in the rearview mirror.
In addition to basic financial statements, many companies have data living in software systems for customer relationship management (CRM), sales pipeline, accounting, human resources, and more. The information is there, but it’s siloed, muddy, and not actionable. CEOs don’t have time to download and sift through multiple reports. They need the information at a glance.
CEOs and company leaders need to have their finger on the pulse and be predictive rather than purely reactive. They need to know what’s happening in their company right now and anticipate what’s going to happen tomorrow, next month, next year, and in the future.
Solution: Add a strategic layer on top of these systems that consolidates and extracts the data to provide a real-time and forward-looking view in one place.
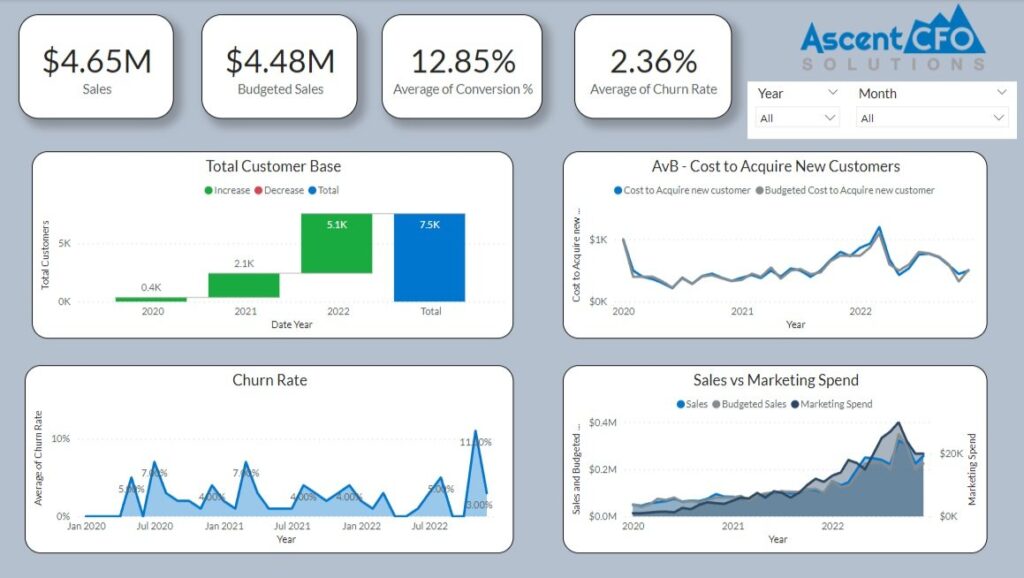
To access the right data, at the right time, in the right place, invest in a data visualization tool that is fully connected to your business and customized to provide the information your company needs. When data is pulled from across the entire organization, CEOs and company leaders can see a real-time, holistic view of their company in an easy-to-read and digestible format.
Insights by Ascent CFO, for example, is designed to be a singular place where leaders can visualize and interact with historic, current, and future metrics.
As strategic Fractional CFOs, we know the forward-looking piece is key. It’s challenging for CEOs to look forward 12, 24, or 36 months, but that’s what an investor wants you to do. And that’s what’s going to help you successfully guide your company. We work closely with companies to develop visual financial models so they can project forward with confidence and improve their decision-making.
When data is truly harnessed as a tool, leaders can have easy access to the information they crave immediately. They can see what is going on across their company at that moment, and they can more confidently answer “what are the next 12 months going to look like?” to effectively lead their team.

Problem #2: You’re not tracking the right metrics and KPIs for your specific company.
As a company leader, you know you should be tracking metrics and KPIs, but how are you using them? Are you actually tracking the metrics and KPIs that are the most helpful for your day-to-day management?
It’s common for companies to “check the box” to say that they collect data and track KPIs without fully knowing why or what data is actually critical for their operations. A leader can search for the “10 most important KPIs in the financial services industry” but that won’t necessarily tell them which metrics are critical to their ability to make operating decisions. The answer to which data is critical for your organization is going to be different for every company, even within the same industry sector. Not every company is structured the same or has the same business plan. Every business has unique levers that it can pull.
What’s the lifetime value of a client? What’s the margin on each client? Each office? Each product or service line? Leaders need the right metrics and they need to be tracking them in real-time.
Solution: Extract the most important metrics and KPIs from your CEO and key operators. Not Google.
At Ascent CFO Solutions, every engagement begins with a deep-dive immersion phase in which our Fractional CFOs have conversations with the CEO and key operators to gain a comprehensive view of current business operations, challenges and market opportunities. We take the leaders out of their “day-to-day operator” headspace so they can take a step back and have a more strategic forward-looking view of the business, and we listen.
The result of these in-depth conversations is identifying specific key metrics of the business and developing a deeper understanding of the business’s expectations and priorities, but they begin with open-ended questions, such as:
- “What keeps you up at night?”
- “What are the opportunities that you have visibility into?”
- “What are the challenges you see?”
- “How does this impact your business?”
When the leader is open and candid, shares what’s on their mind, and lets us into the inner workings of the organization, we are able to see the business holistically and hone in on what’s important. We help leaders identify the key metrics in their company and track them in a way that has a positive impact on the growth of their organization.

Problem #3: You’re paying too much attention to revenue instead of cash.
Revenue and cash are not the same. Revenue (money generated from the sale of goods and services) is an important metric, but cash flow (how much cash is being produced or consumed) is the lifeblood of your business. You could project a healthy year: revenues are X, expenses are Y, and profit margin is Z. But what’s the timing of those revenues and expenses coming in? That could tell a very different story. Companies need to have a clear understanding of their historical and future working capital needs.
For example, your income statement may show strong month-over-month revenue growth, but if your accounts receivable are being stretched (signaled by a high days sales outstanding (DSO) – the average number of days it takes a company to collect cash from credit purchases), you may find yourself in a cash crunch. This will negatively impact your ability to pay your bills or make payroll. Cash is king (cliché but true)!
This is why it’s important to utilize accrual accounting (an accounting method that matches revenue and expenses when incurred) and have clear visibility into your cash flow cycle (how long it takes your company to convert resources into cash flow).
Solution: Look for a tool that can visualize cash flow and the interconnectedness of your business.
Cash flow is a metric that can be challenging to wrap one’s head around. Look for a tool that can visualize cash flow so you can more easily recognize and digest patterns in your cash that will help you make informed decisions. When CEOs see their cash visualized, it’s often a big lightbulb moment.
Every element of a business is interconnected. When a CEO pulls one lever, it affects other variables. As businesses grow, the complexities increase. Company leaders can do fairly well by just focusing on the blocking and tackling for a while – employing basic pricing models and paying attention to expenses, for example. But if a CEO really wants to grow and fine-tune their business, there is so much more they need to pay attention to. Bigger deals may require negotiating 30, 60, or 90-day payment terms. You probably need to hire more people. You probably have more product and service lines. What impact does all of this have on cash flow?
It’s easiest for a CEO to understand the health and inner workings of their business when it’s displayed visually. When they pull a lever, they can actually see what happens. Patterns become clear and problematic timing becomes much easier to recognize.
It’s worth investing in a tool that will go beyond numbers in a spreadsheet and display the interconnectedness of the business in a visual, intuitive way.
Start Harnessing Your Data for Growth Insights
It can be difficult to extract meaningful insights from your company’s data. But with the right tool and strategic guidance, it’s possible to have information at your fingertips that will enable you to make smarter, more informed decisions.
To learn more and watch a 2-minute video of Insights by Ascent CFO, click here.
Contact us to schedule a call to discuss your company’s unique needs and path to growth!
Contact Us
Questions or business inquiries regarding our part-time CFO, finance and accounting services are welcome at: info@ascentcfo.com