


Key Takeaways
- A disciplined, multi-layer data architecture—covering ingestion, standardized metrics, visualization, and governance—is essential for building reliable real-time dashboards that drive business growth.
- Effective real-time dashboards connect source systems, standardize key financial metrics, and deliver role-based insights, enabling leaders to make faster, data-driven decisions rather than relying on outdated reports.
- Partnering with financial data experts like Ascent CFO Solutions accelerates dashboard implementation, ensures data quality, and avoids common pitfalls, allowing scaling companies to focus on strategic growth.
Growth stalls when executives make critical hiring and investment decisions with week-old data. Companies miss market opportunities and cash flow risks when unit economics, pipeline health, and cash runway visibility remain locked in separate systems until monthly board meetings. The solution lies in building real-time dashboards that connect your scattered source systems into one decision-ready view.
The path forward requires a three-layer data architecture that transforms raw system data into CFO-ready insights. Smart companies build for decision latency, not just data latency, creating dashboards that answer executive questions before they’re asked.
Partner with Ascent CFO Solutions to transform your financial data into the real-time visibility that accelerates growth decisions.

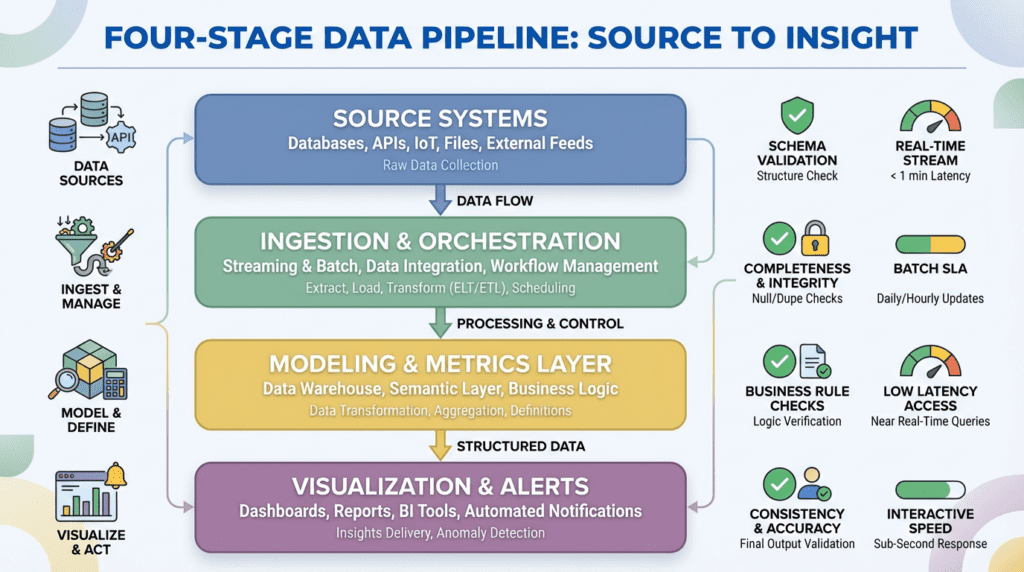
The Real-Time Dashboard Pipeline: From Source Systems to Insight
Building effective live dashboards requires more than connecting a few APIs to a visualization tool. The key steps to connect business systems to a real-time dashboard involve creating a structured pipeline that moves information reliably from source platforms to actionable financial insights. This approach prevents the common pitfall of building dashboards that look impressive but fail when you need them most.
Layer 1: Data Ingestion with APIs, Webhooks, and Change Data Capture
Your ingestion layer determines how fresh your information stays and how reliably it flows. APIs work well for periodic updates, while webhooks provide near-instant notifications when information changes. For high-volume transactional platforms, change data capture (CDC) tracks only what changed since the last update, reducing system load while maintaining information freshness. Choose your ingestion method based on how quickly you need to see changes and how much volume you handle.
Layer 2: Semantic and Metrics Layer for Consistent Definitions
Once information flows reliably through your ingestion layer, raw inputs from different applications often use inconsistent formats and definitions. Your modeling layer creates a semantic foundation where “revenue” means the same thing across sales, finance, and operations. This layer calculates your core metrics once and serves them consistently to all dashboards. Without this step, teams inadvertently work with conflicting definitions of the same metric.
Layer 3: Role-Based Visualization and Alerting
Your visualization layer should answer specific questions for specific roles. Finance leaders need cash runway and burn rate trends, while operations teams need live performance metrics. Set service level agreements (SLAs) that match decision urgency: sub-hour freshness for financial reporting works because monthly close processes can accommodate brief delays, while sub-minute updates for operational alerts prevent costly service disruptions. Ascent CFO Solutions designs dashboards that automatically alert stakeholders when metrics cross predefined thresholds, turning business intelligence into action.
Layer 4: Governance Framework That Scales
Governance forms the foundation that prevents expensive rework as you grow. Information cataloging documents what each field means and where it originates. Standardized metric definitions eliminate confusion over conflicting revenue calculations. Access controls ensure sensitive financial information reaches the right people. Companies that implement strong governance early avoid the common scenario where rapid growth forces a complete dashboard rebuild. Inconsistent definitions create more confusion than clarity.
Choosing the Right Integration Pattern: APIs, Webhooks, and ELT
When integrating source systems with dashboards, your choice of data ingestion pattern directly impacts both speed to market and long-term reliability. The right approach balances development velocity with operational stability as your company scales.
Smart integration decisions prevent technical debt that slows growth. Focus on these proven integration strategies:
- Choose managed connectors over custom scripts for standard systems like Salesforce, Stripe, or QuickBooks to accelerate deployment
- Implement incremental loads with change tracking to respect API rate limits while maintaining fresh data
- Build retry logic and dead-letter queues to handle temporary failures without losing critical business data
- Store original data first then transform it for specific dashboard needs, allowing flexibility as reporting requirements evolve
- Plan for schema changes by designing flexible pipelines that adapt when source systems add or modify data fields
These patterns form the foundation for reliable data analytics that scales with your business. The push, pull, and poll approaches each serve different latency and reliability needs, while resilient webhook handlers prevent data loss during system outages.
With solid integration patterns in place, you can focus on designing dashboards that drive actual business decisions with strategic financial leadership rather than just displaying pretty charts.
Design Dashboards That Drive Financial Decisions
Scaling companies often struggle with dashboards that display impressive charts but fail to guide critical choices about hiring, pricing, or cash management. Real-time dashboards improve financial decision-making when they connect every metric to a specific business outcome and automate the monitoring that keeps leaders proactive rather than reactive.
- Map each widget to specific business choices like setting hiring freeze thresholds when cash runway drops below six months
- Standardize 66 core fields including ARR, CAC, payback periods, and COGS drivers across all teams and systems
- Define latency requirements based on how quickly choices must be made, not how easy the data is to collect
- Automate 98% of routine updates through scheduled refreshes, threshold alerts, and anomaly detection
- Create role-based views that surface relevant metrics for each stakeholder’s responsibilities and authority level
Effective financial dashboards transform reporting from a historical summary into a strategic advantage. When teams can see cash runway, unit economics, and growth metrics in context, they spend less time gathering data and more time executing the strategic initiatives that drive sustainable growth.
Real-Time Dashboard FAQs for Scaling Companies
Scaling companies often encounter similar challenges when connecting disparate systems to create unified dashboards. Understanding what challenges companies face integrating source systems with dashboards helps leaders make informed decisions about timelines, technical approaches, and partnership strategies.
What does “real time” actually mean for finance versus operations?
“Real time” varies by business function and decision urgency. Operations teams need sub-minute updates for inventory or customer support metrics. Finance teams typically require hourly or daily freshness for cash flow, revenue recognition, and budget variance analysis. Setting appropriate data SLAs based on decision latency prevents over-engineering while meeting business needs.
How long does implementation take from start to finish?
Most dashboard projects follow three phases over 30-90 days. Discovery and planning take 1-2 weeks to inventory systems and define requirements. Build and integration require 4-8 weeks depending on system complexity. Testing and refinement add another 1-2 weeks before go-live. Ascent’s Data Analytics & Insights approach typically delivers results within 30 days through streamlined processes.
Should we build internally, buy software, or partner with experts?
Building internally gives control but requires specialized data engineering talent and ongoing maintenance. Buying software offers speed but may lack financial expertise and customization. For most scaling companies, partnering with financial data experts provides the optimal balance of technical capability and CFO-level insight while reducing implementation risk.
How do we maintain data quality as we scale across multiple systems?
Data quality degrades without governance frameworks and automated validation. Implement data quality checks at ingestion points, standardize naming conventions across systems, and establish clear ownership for each data source. Successful implementations often save 10-15 hours monthly through automated reconciliation and error detection.
What happens when source systems change or add new data fields?
Source system changes can disrupt dashboards without proper planning. Modern integration platforms handle schema evolution through automated detection and mapping updates. The key is designing flexible data models that accommodate new fields without requiring complete rebuilds. Regular monitoring and version control prevent silent failures when systems evolve.

From Data Chaos to Real-Time Clarity: Your Next Step
Building real-time dashboards requires a disciplined three-layer approach: smart data ingestion, a standardized metrics layer, and decision-focused visualization. The companies that succeed establish data SLAs early and design dashboards around specific business decisions rather than just displaying data.
Partnering with a financial data expert accelerates this process by avoiding common pitfalls and
overbuilding. A strategic 3-hour discovery session can inventory your current systems, define your key performance indicators, and establish realistic latency targets before you invest in infrastructure.
The path forward is clear: Transform your financial operations from reactive spreadsheets to proactive, real-time insights. Start with a strategic discovery process to map your data landscape and prioritize the dashboards that will drive your next growth phase.
Ascent CFO Solutions can help you build the financial intelligence system your scaling business needs.
Contact Us
Questions or business inquiries regarding our part-time CFO, finance and accounting services are welcome at: info@ascentcfo.com